Getting Started in R and RStudio
The objectives of the guide are as follows:
Install and set up R and RStudio.
Understand working in R Markdown and Quarto.
This lab guide supplements the material presented in Introduction and Chapter 4 in the textbook R for Data Science (RDS).
What is R?
R is a free, open source statistical programming language. It is useful for data cleaning, analysis, and visualization. R is an interpreted language, not a compiled one. This means that you type something into R and it does what you tell it. It is both a command line software and a programming environment. It is an extensible, open-source language and computing environment for Windows, Macintosh, UNIX, and Linux platforms, which allows for the user to freely distribute, study, change, and improve the software. It is basically a free, super big, and complex calculator. You will be using R to accomplish all data analysis tasks in this class. You might be wondering “Why in the world do we need to know how to use a statistical software program?” Here are the main reasons:
You will be learning about abstract concepts in lecture and the readings. Applying these concepts using real data is an important form of learning. A statistical software program is the most efficient (and in many cases the only) means of running data analyses, not just in the cloistered setting of a university classroom, but especially in the real world. Applied data analysis will be the way we bridge statistical theory to the “real world.” And R is the vehicle for accomplishing this.
In order to do applied data analysis outside of the classroom, you need to know how to use a statistical program. There is no way around it as we don’t live in an exclusively pen and paper world. If you want to collect data on soil health, you need a program to store and analyze that data. If you want to collect data on the characteristics of recent migrants, you need a program to store and analyze that data.
The next question you may have is “I love Excel [or insert your favorite program]. Why can’t I use that and forget your stupid R?” Here are some reasons
it is free. Most programs are not;
it is open source. Which means the software is community supported. This allows you to get help not from some big corporation (e.g. Microsoft with Excel), but people all around the world who are using R. And R has a lot of users, which means that if you have a problem, and you pose it to the user community, someone will help you;
it is powerful and extensible (meaning that procedures for analyzing data that don’t currently exist can be readily developed);
it has the capability for mapping data, an asset not generally available in other statistical software;
If it isn’t already there, R is becoming the de-facto data analysis tool in the social sciences
R is different from Excel in that it is generally not a point-and-click program. You will be primarily writing code to clean and analyze data. What does writing or sourcing code mean? A basic example will help clarify. Let’s say you are given a data set with 10 rows representing people living in Red Hook, NY. You have a variable in the data set representing individual income. Let’s say this variable is named inc. To get the mean income of the 10 people in your data set, you would write code that would look something like this:
mean(inc)
The command tells the program to get the mean of the variable inc. If you wanted the sum, you write the command sum(inc).
Now, where do you write this command? You write it in a script. A script is basically a text file. Think of writing code as something similar to writing an essay in a word document. Instead of sentences to produce an essay, in a programming script you are writing code to run a data analysis. The basic process of sourcing code to run a data analysis task is as follows:
Write code. First, you open your script file, and write code or various commands (like
mean(inc)) that will execute data analysis tasks in this file.Send code to the software program. You then send some or all of your commands to the statistical software program (R in our case).
Program produces results based on code. The program then reads in your commands from the file and executes them, spitting out results in its console screen.
I am skipping over many details, most of which are dependent on the type of statistical software program you are using, but the above steps outline the general work flow. You might now be thinking that you’re perfectly happy pointing and clicking your mouse in Excel (or wherever) to do your data analysis tasks. So, why should you adopt the statistical programming approach to conducting a data analysis?
- Your script documents the decisions you made during the data analysis process. This is beneficial for many reasons.
It allows you to recreate your steps if you need to rerun your analysis many weeks, months or even years in the future.
It allows you to share your steps with other people. If someone asks you what were the decisions made in the data analysis process, just hand them the script.
Related to the above points, a script promotes transparency (here is what i did) and reproducibility (you can do it too). When you write code, you are forced to explicitly state the steps you took to do your research. When you do research by clicking through drop-down menus, your steps are lost, or at least documenting them requires considerable extra effort.
If you make a mistake in a data analysis step, you can go back, change a few lines of code, and poof, you’ve fixed your problem.
It is more efficient. In particular, cleaning data can encompass a lot of tedious work that can be streamlined using statistical programming.
Lab: install R and RStudio
Lab Goals
The purpose of this lab is to ensure that you have installed and configured all the software you’ll need to create productive working environment for reproducible scientific computing.
After completing this lab, you should have installed R, RStudio (which also includes Quarto with it), and be able to render this Quarto document!
Instructions for Installing R and RStudio
The steps needed to set up a reproducible scientific computing environment depend on the type of computing device you have. Find your computing device in the list below, and click on the link to continue the lab:
Set up instructors for Apple MacBooks
Set up instructions for Windows
If you’re not sure what kind of computing device you have, please ask your instructor for help. If you do not have regular access to a MacBook or Windows PC, please consult with your instructor.
What is RStudio?
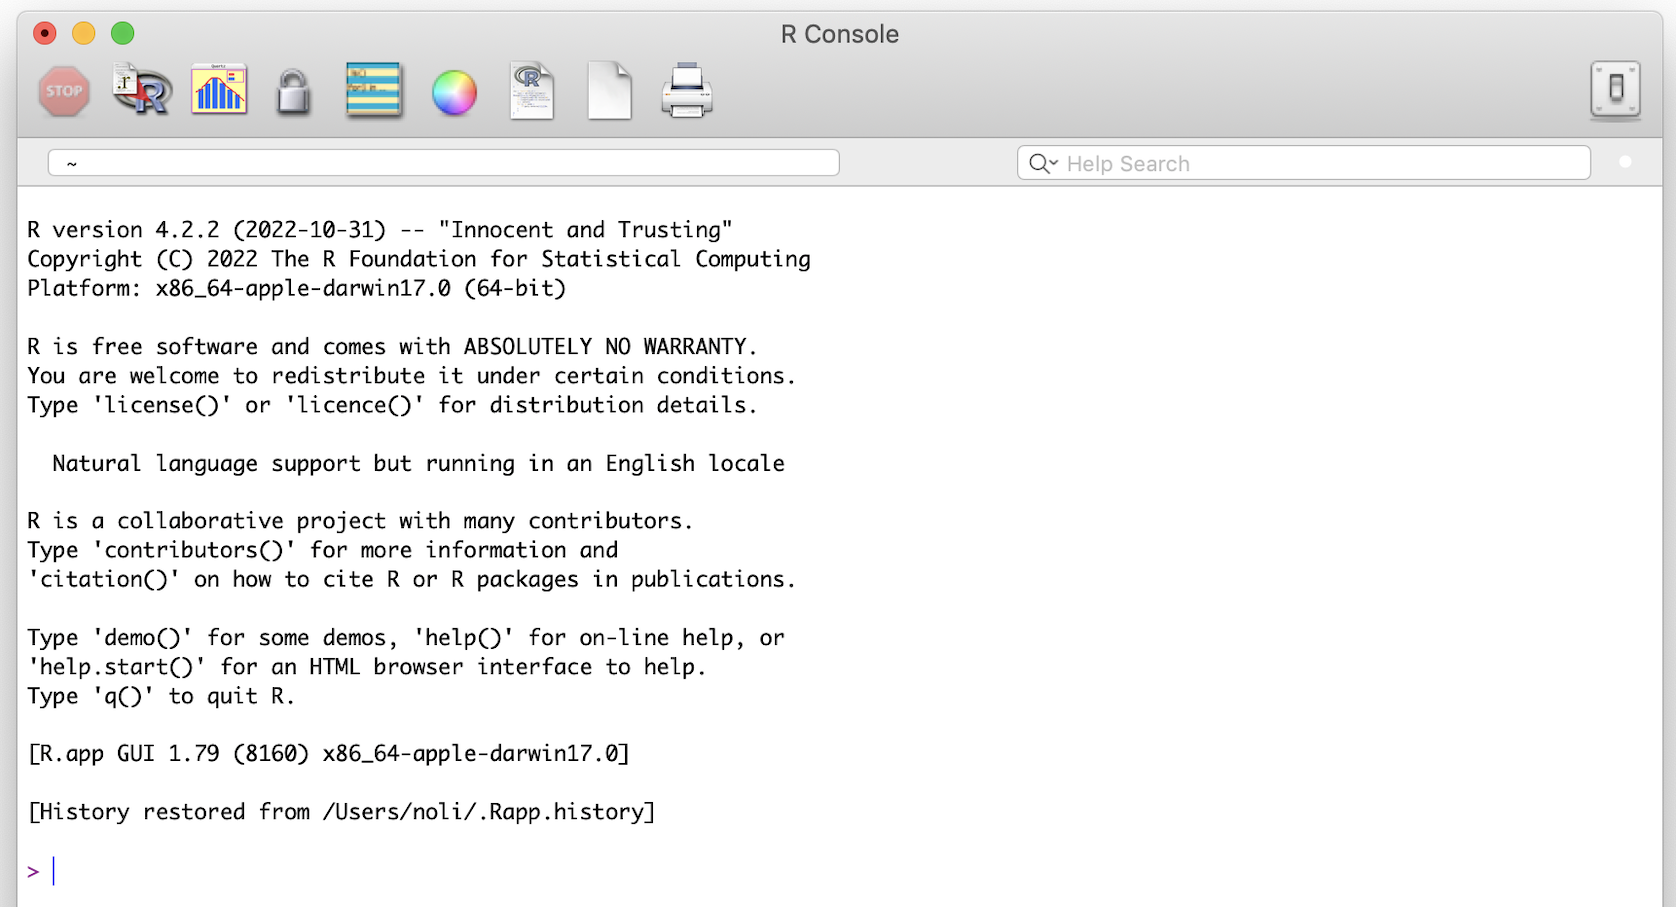
If you click on the R program you just downloaded, you will find a very basic user interface. For example, below is what I get on a Mac.
The RStudio Interface
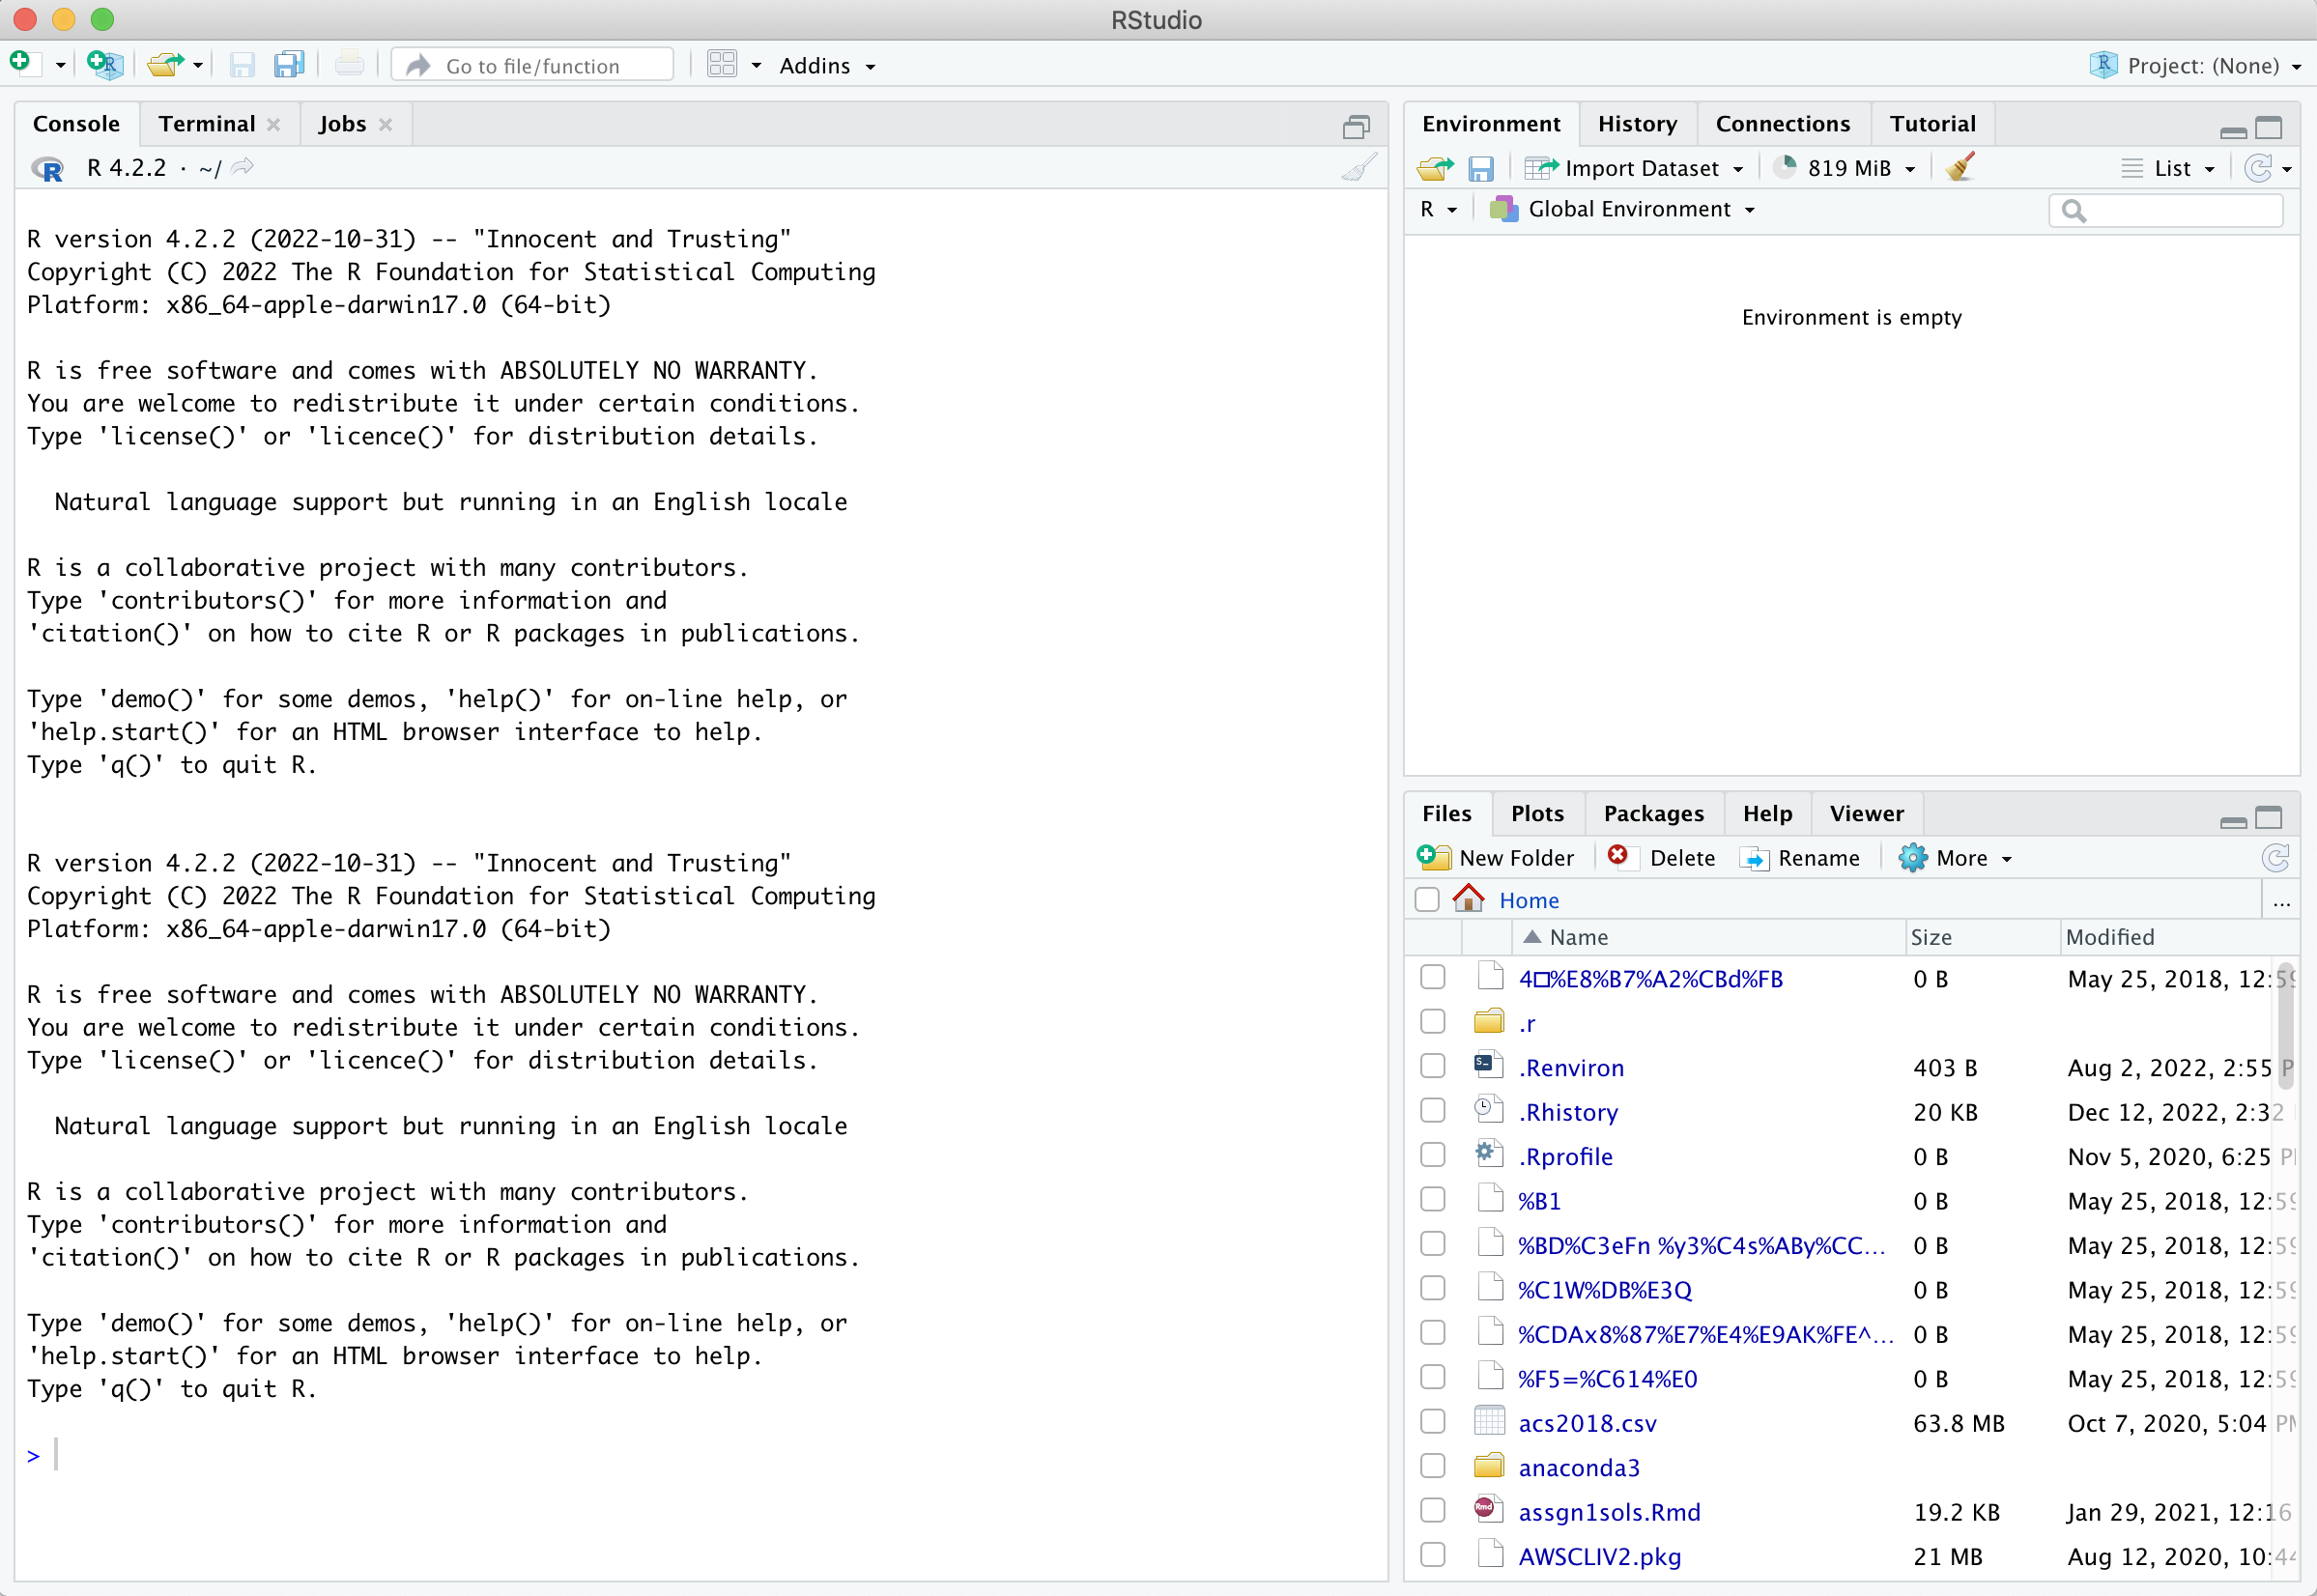
Open up RStudio. You should see the interface shown in the figure below which has three windows.
Console (left) - The way R works is you write a line of code to execute some kind of task on a data object. The R Console allows you to run code interactively. The screen prompt
>is an invitation from R to enter its world. This is where you type code in, press enter to execute the code, and see the results.Environments: Environment, History, and Connections tabs (upper-right)
Environment - shows all the R objects that are currently open in your workspace. This is the place, for example, where you will see any data you’ve loaded into R. When you exit RStudio, R will clear all objects in this window. You can also click on
 to clear out all the objects loaded and created in your current session.
History - shows a list of executed commands in the current session.
Connections - you can connect to a variety of data sources, and explore the objects and data inside the connection. I typically don’t use this window, but you can.
Output: Files, Plots, Packages, Help and Viewer tabs (lower-right)
Files - shows all the files and folders in your current working directory (more on what this means later).
Plots - shows any charts, graphs, maps and plots you’ve successfully executed.
Packages - tells you all the R packages that you have access to (more on this later).
Help - shows help documentation for R commands that you’ve called up.
Viewer - allows you to view local web content (won’t be using this much).
Source
- The source pane allows users to view and edit various code-related files, such as .R, .rmd, .qmd, .py, .css, or general text files such as .txt or .md. By default it is the top-left panel and can be launched by opening any editable file in RStudio. Each additional file that is opened will be added as a new tab within the Source pane.
Running R code using the console (bottom left in figure below) is a great place to start, but has its limitations. Each time you want to execute a set of commands, you have to re-enter them at the command line. Complex commands are potentially subject to typographical errors, necessitating that they be re-entered correctly. Repeating a set of operations requires re-entering the code stream. To give yourself more room to work, it’s a great idea to use the R script editor in the Source pane.
A script is simply a text file containing a set of commands and comments. The script can be saved and used later to re-execute the saved commands. The script can also be edited so you can execute a modified version of the commands.
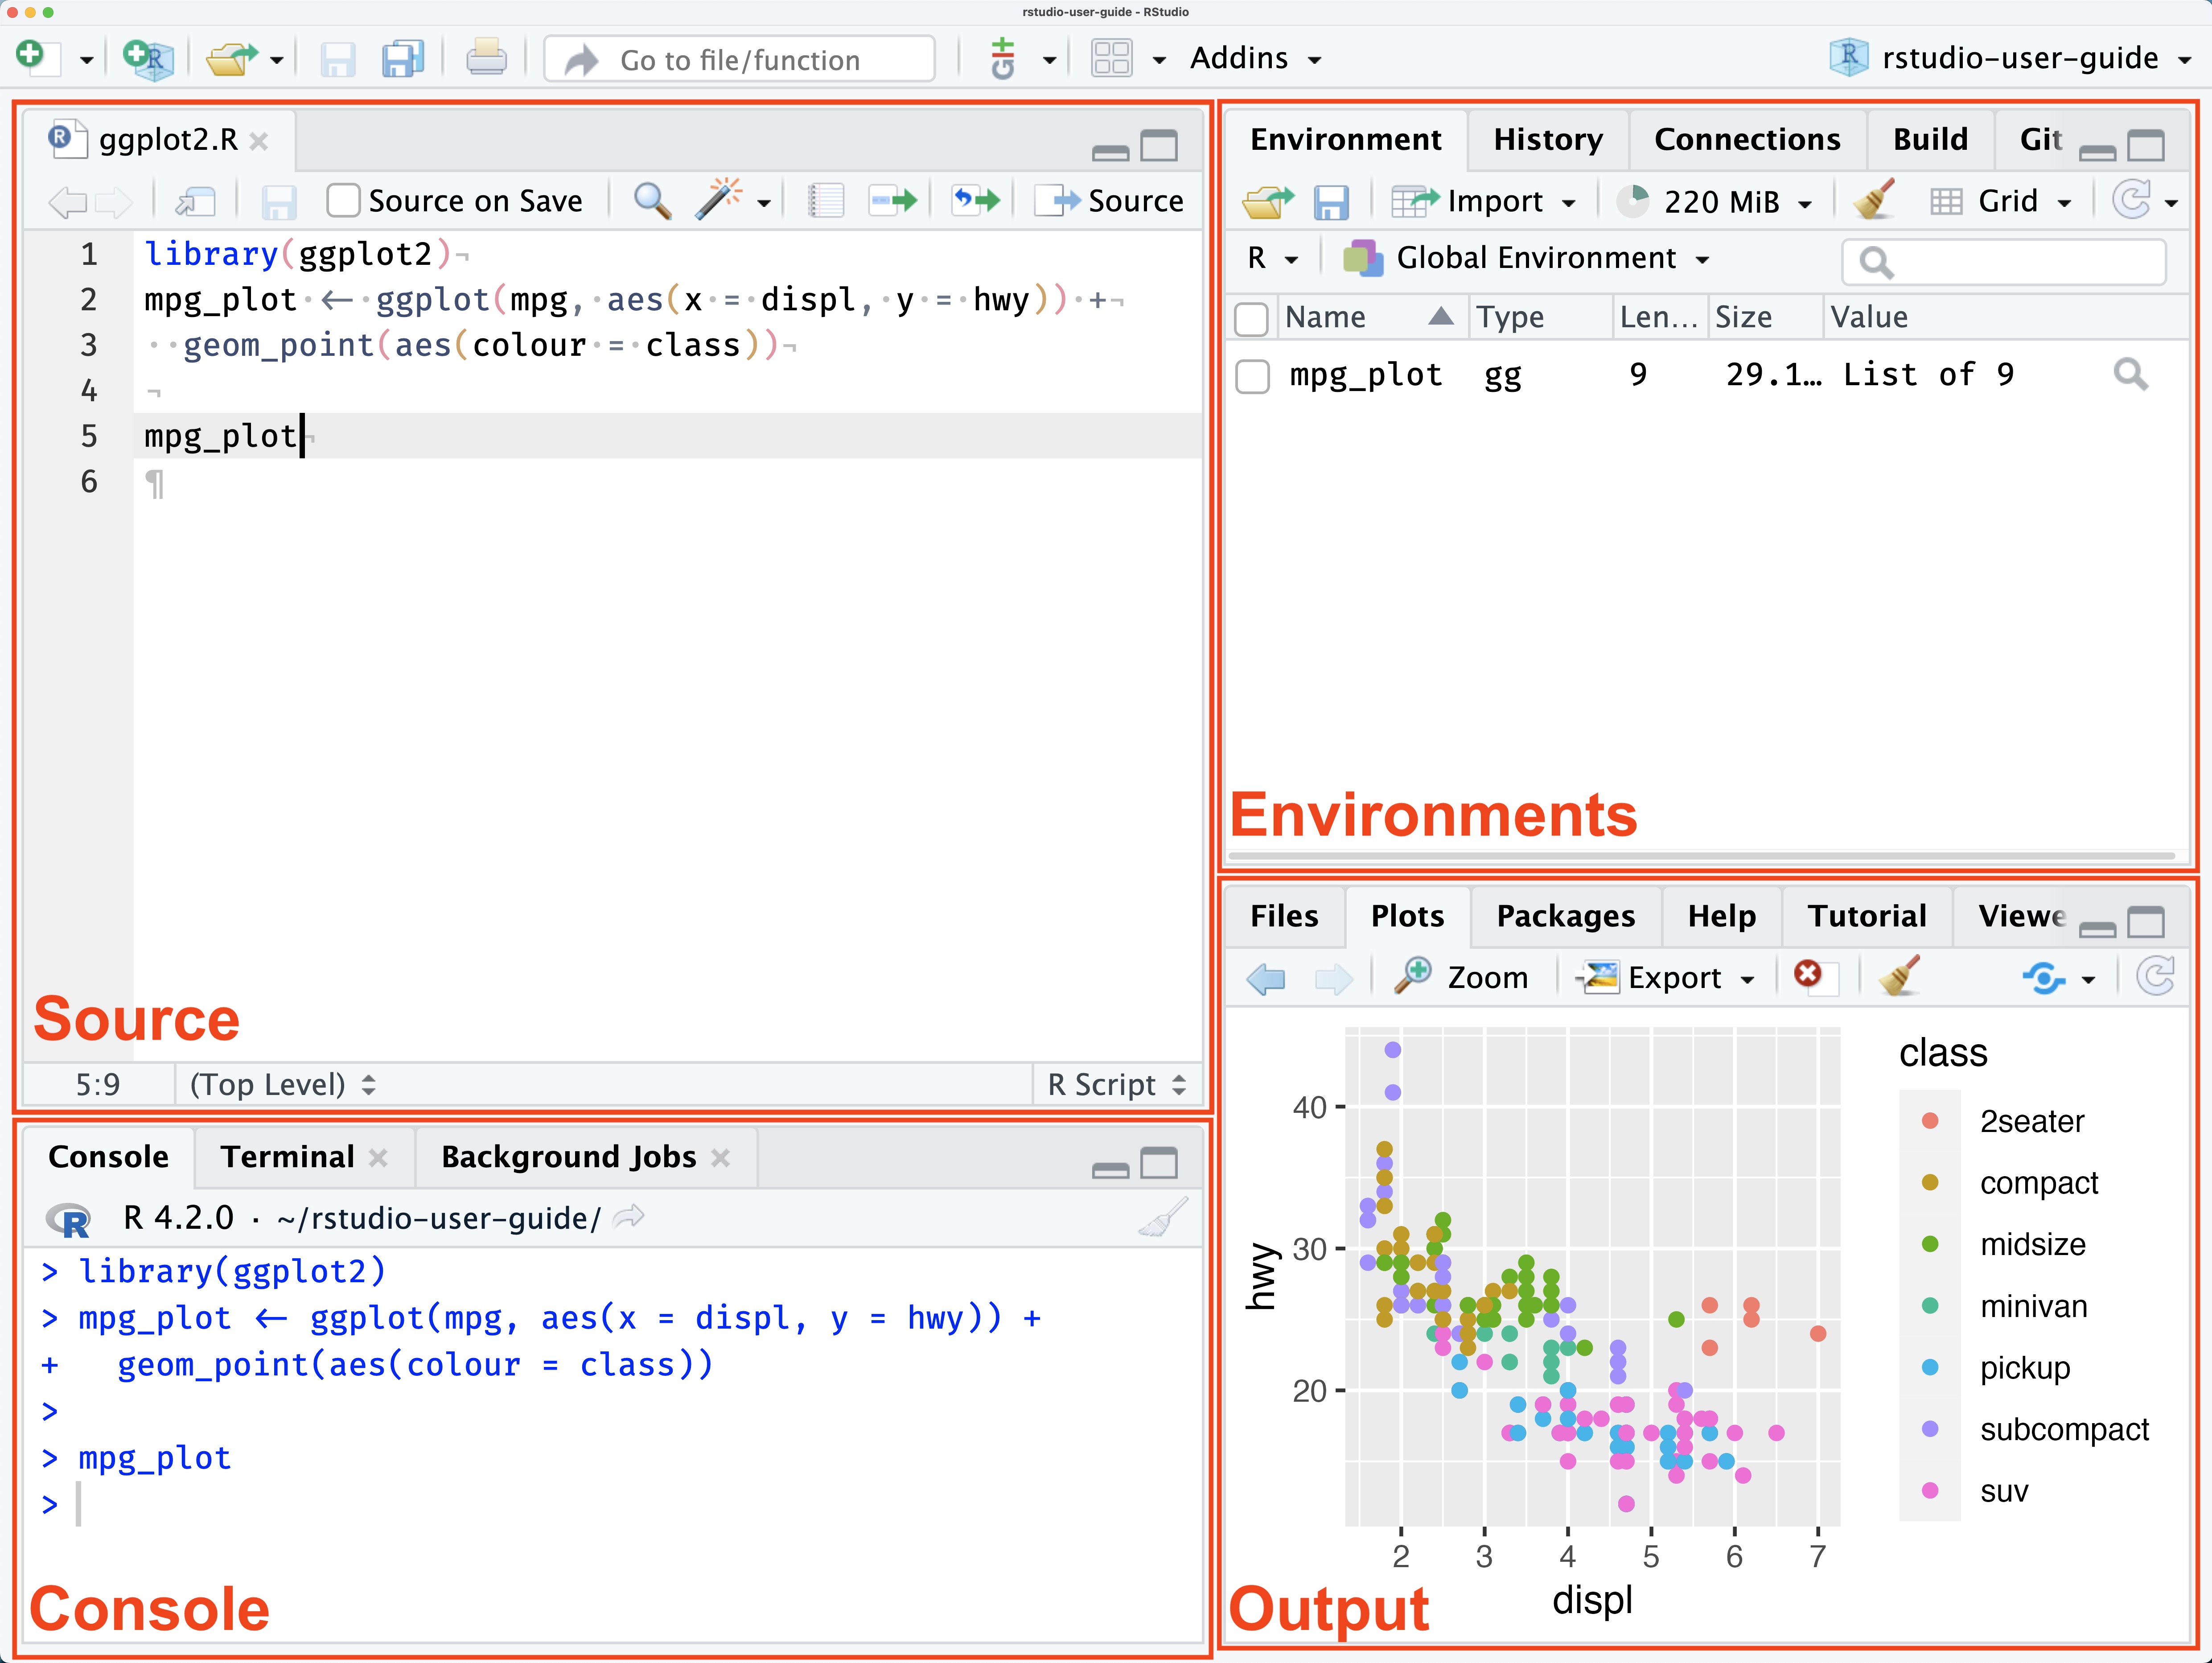
You can open a new empty script by clicking the New File icon in the upper left of the main RStudio toolbar. This icon looks like a white square with a white plus sign in a green circle. Clicking the icon opens the New File Menu. Click the “R Script” option and the script editor will open with an empty script in the Source pane. Your R Studio should look similar to below (image source: R for Data Science)
R Markdown documents take script files to a new level by allowing you to mix R commands with explanatory text. Think of an R Markdown document as an R script on steroids. Your R Markdown source document is compiled into an output report evaluating the R commands in the source document to produce easily reproducible results in an aesthetically pleasing form. It combines code, results from the code, and narrative text explaining the results to produce beautiful documents and academic reports.
References
Smith College SDS 100
Noli Brazil (UC Davis).