Explore US Cities
Intro to Data Analytics
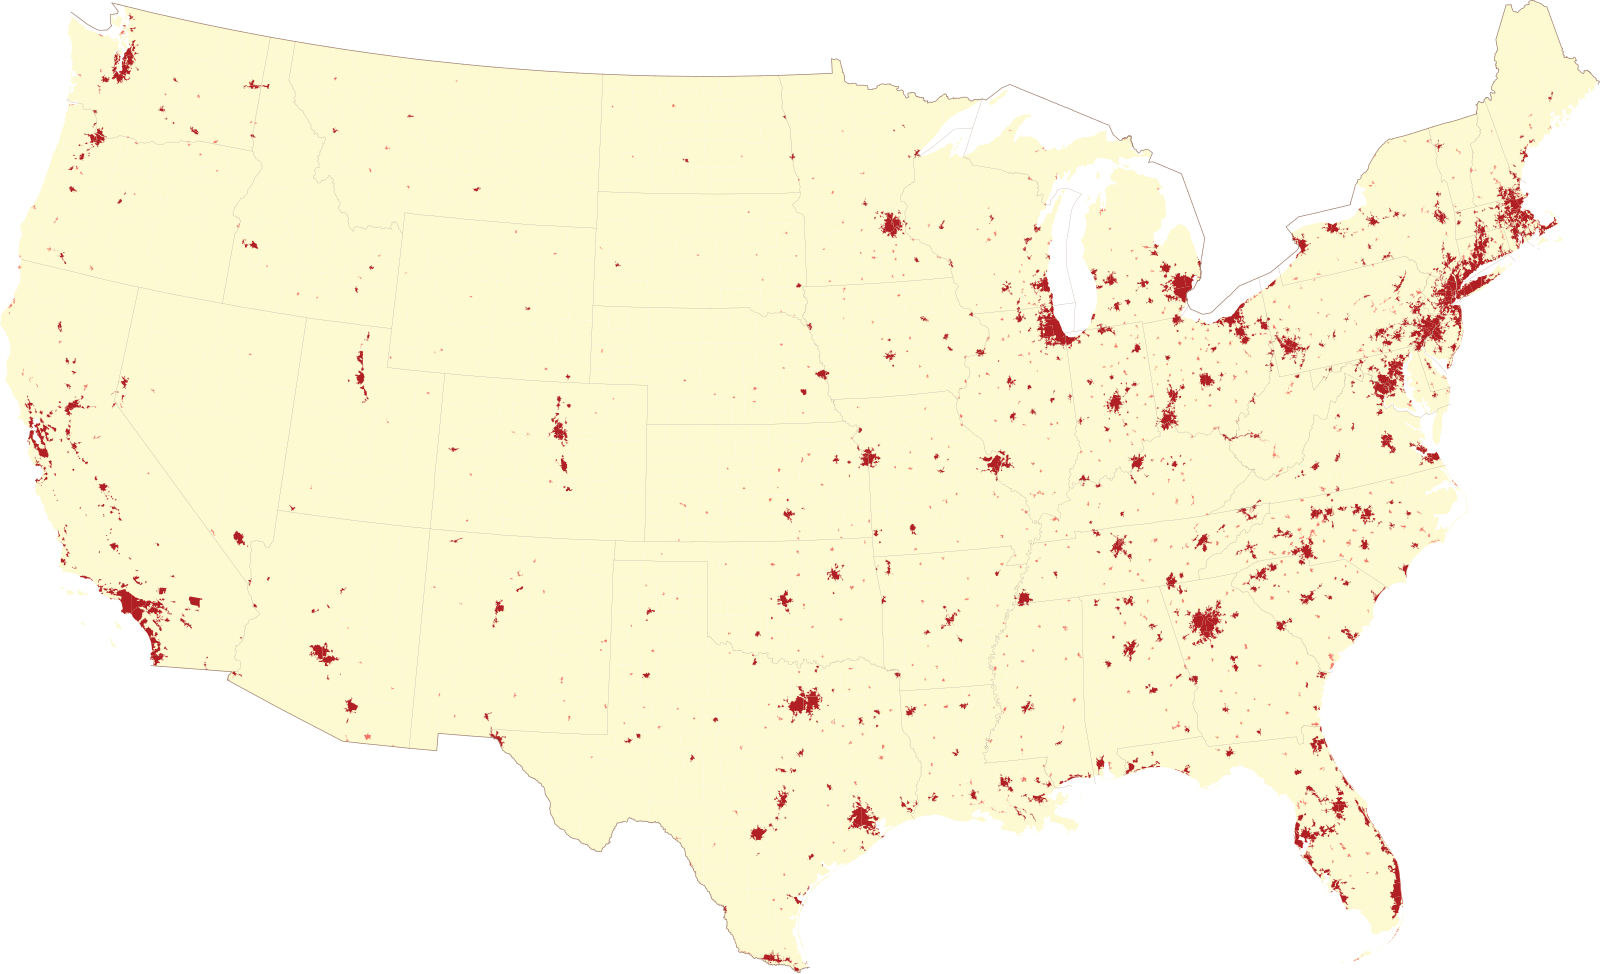
Exploring Metropolitan Areas in the US
Practicing R Basics
Before we start, some review
- How do you install a package in R?
- How do you load a package into your R session?
- What are two ways to create the sequence of numbers 10, 11, 12….25?
- Create a vector containing all of the positive even numbers smaller than 60.
- Create a vector of numbers that starts at 6, does not pass 55, and adds numbers in increments of 4/7: 6, 6 + 4/7, 6 + 8/7, and so on.
- How many number entries does the vector have? Hint: use
seqandlength
- How many number entries does the vector have? Hint: use
Topics
Corresponds to IDS 2.3-2.9 and IMS Ch 1
Data frames
Sorting
Indexing
Getting started
First, open up your RStudio project folder and select the .Rproj file to open RStudio.
Within RStudio, access the Files pane (bottom right window) and navigate to your
/activitiesfolder.Create a new Quarto document for today’s in-class activity called
us_cities_activity_Rbasics.qmdCreate a code chunk in the Quarto and load the
tidyversepackage in your RStudio environment usinglibrary(tidyverse)The tidyverse package of packages contains a package calledreadrthat helps us cleanly read in data files.
Exploring Metropolitan Areas in the US
How do metropolitan areas in the US compare?
Which metro area is the largest by land area?
What are the top 10 metro areas by population?
Where does it cost the most to rent a home?
Which areas have the highest median income?
Bring data into R
In the Files pane, create a new folder called
datawithin your/activitiesfolder.Download the data set
us_metro_areas.csvfile avaialable here (link), and place the file in your new/datafolder.Double check your working directory by running
getwd(). The result shown in the Console pane should be similar to"/Users/username/Documents/CMSC 121".Create a new code chunk in your Quarto and read in the .csv using the following code:
us_metro_areas <- read_csv("activities/data/us_metro_areas.csv")
Explore the data
What is the class of the
us_metro_areasobject?Use the
head()andglimpse()functions to explore the object.Open the data frame in a table from the Environment pane.
Use the
names()function to see all of the columns in the object.
Practice R Basics
- Assign a vector of the total population for all US metro areas to the object
pop - What is the class of the object
pop? - How many entries are in the total population vector object?
- What is the total land area of all metro areas in the US?
Accessing using [[ ]]
We can also use double square brackets ([[) to access a vector in a data frame:
us_metro_areas[["pct_children"]] # Access the column with the percentage of the population under age 18
Next, access the area in square miles of US metro areas and assign the vector to the object area
Coercion
- Create a vector of median household income
median_hh_incomefor US metro areas - What is the class of the median household income column?
Coercion
- Coerce the object from numeric to character
- Calculate the average median household income for US metro areas and assign it to the object
metro_average_income - Coerce the vector object back to numeric.
Sorting and subsetting
Which metro areas have the largest population?
Which metro areas have the highest median income?
What other questions could we ask?
Sorting
- Use the
$operator to access the population total data and store it as the objectpop. - Then use the
sortfunction to redefinepopso that it is sorted. - Finally, use the
[operator to report the smallest population size:pop[1]
Sorting
- Use the
args()function to learn about the argument options for thesort()function. - How do we sort from highest to lowest?
Sorting
- Use the second argument in the
sort()function to sort thepopvector from highest to lowest. Assign the result to a new objectpop_desc. - Use the
[and:operators to access the top 10 metro areas by population. Add the result to the objecttop10_pop
Which are the population totals for the top 10 largest metro areas?
Subset
- Create a vector that contains the population density of the metro areas.
pop_density <- us_metro_areas$total_pop / us_metro_areas$`area sq miles`
- Create an object
indthat tells use where population density is greater than 500 people per square mile- What type of object is
ind? What does it tell us?
- What type of object is
- Create an object
pop_density_over500that contains all metro area names with population density over 500 people per square mile. Use theindobject to compute.
Subset
- What is the median population density in US metro areas?
median_density <- median(pop_density)
- Create an object
above_medianthat indicates where population density is greater than or equal to the median population density.
Working with a logical vector
How many metro areas have a population density greater than or equal to the median? Use the sum() function.
Try the same process with the average population density.
Subset and index
- Which metro areas have above median density?
us_metro_areas$city[above_median]
- How many metro areas have density above 1,000 people per square mile?
- Which metro areas?
Sorting, logicals, and indexing
What are the most expensive cities to rent a home in the US?
- Create a vector with the median home rent for all US metro areas
- Sort the resulting vector from highest to lowest
- Use
[to select only the top 10 highest values for median rent in the US - What is the 10th highest median rent?
- Create a logical vector
indwhere the median rent is greater than or equal to the 10th highest median rent. - Use the
indlogical vector to display the 10 most expensive metro areas to rent.
Order()
Order takes a vector as input and returns the vector of indexes that sorts the input vector.
Which metro areas have the lowest percentage of the population under age 18?
- Create a vector with the percentage of children variable
- Sort the pct_children column lowest to highest. Do not assign the result to a new object.
- Use the
order()function on the vector containing the values for pct_children. This creates an index of the position of entries in the vector based on the value of the percentage children variable, lowest (1) to highest (873). - Assign the ordered vector from step 3 to an object
index. - Use the
indexvector to create a new objectchildrenwith the names of metro areas sorted by the percentage of children. Hint: the first city entry should be Punta Gorda, FL Area. - Use
[to show the 10 metro areas with the lowest percentage of children.
Practice
Use
order()to display the top 10 US cities by median rent.Use
order()to display which 5 metro areas have the highest percentage of land area covered by parks.Use
order()to display the 10 cities with the highest rates of asthma among adults.