Introduction to Tidyverse
Intro to Data Analytics
Getting Started
- Create a new Quarto doc in your course RStudio project to follow along and take notes (you do not need to submit)
- Load the
tidyversepackage.
Where we are heading
We will be using the ggplot2 package to visualize data as a part of the exploratory data analysis workflow
ggplotexpects your data to be organized in a “tidy” layout (Wickham 2014).
A quick example
Load data (download the hotels dataset for practice later)
- What are some ways that we can learn more about the hotels data?
Data: Hotel bookings1
- Data from two hotels: one resort and one city hotel
- Observations: Each row represents a hotel booking
- Goal for original data collection: Development of prediction models to classify likelihood that a hotel’s booking’s would be cancelled (Antonia et al., 2019)
First look: Variables
 [1] "hotel"                          "is_canceled"
 [3] "lead_time"                      "arrival_date_year"
 [5] "arrival_date_month"             "arrival_date_week_number"
 [7] "arrival_date_day_of_month"      "stays_in_weekend_nights"
 [9] "stays_in_week_nights"           "adults"
[11] "children"                       "babies"
[13] "meal"                           "country"
[15] "market_segment"                 "distribution_channel"
[17] "is_repeated_guest"              "previous_cancellations"
[19] "previous_bookings_not_canceled" "reserved_room_type"
[21] "assigned_room_type"             "booking_changes"
[23] "deposit_type"                   "agent"
[25] "company"                        "days_in_waiting_list"
[27] "customer_type"                  "adr"
[29] "required_car_parking_spaces"    "total_of_special_requests"
[31] "reservation_status"             "reservation_status_date"
Second look: Overview
Rows: 119,390
Columns: 32
$ hotel                          <chr> "Resort Hotel", "Resort Hotel", "Resort…
$ is_canceled                    <dbl> 0, 0, 0, 0, 0, 0, 0, 0, 1, 1, 1, 0, 0, …
$ lead_time                      <dbl> 342, 737, 7, 13, 14, 14, 0, 9, 85, 75, …
$ arrival_date_year              <dbl> 2015, 2015, 2015, 2015, 2015, 2015, 201…
$ arrival_date_month             <chr> "July", "July", "July", "July", "July",…
$ arrival_date_week_number       <dbl> 27, 27, 27, 27, 27, 27, 27, 27, 27, 27,…
$ arrival_date_day_of_month      <dbl> 1, 1, 1, 1, 1, 1, 1, 1, 1, 1, 1, 1, 1, …
$ stays_in_weekend_nights        <dbl> 0, 0, 0, 0, 0, 0, 0, 0, 0, 0, 0, 0, 0, …
$ stays_in_week_nights           <dbl> 0, 0, 1, 1, 2, 2, 2, 2, 3, 3, 4, 4, 4, …
$ adults                         <dbl> 2, 2, 1, 1, 2, 2, 2, 2, 2, 2, 2, 2, 2, …
$ children                       <dbl> 0, 0, 0, 0, 0, 0, 0, 0, 0, 0, 0, 0, 0, …
$ babies                         <dbl> 0, 0, 0, 0, 0, 0, 0, 0, 0, 0, 0, 0, 0, …
$ meal                           <chr> "BB", "BB", "BB", "BB", "BB", "BB", "BB…
$ country                        <chr> "PRT", "PRT", "GBR", "GBR", "GBR", "GBR…
$ market_segment                 <chr> "Direct", "Direct", "Direct", "Corporat…
$ distribution_channel           <chr> "Direct", "Direct", "Direct", "Corporat…
$ is_repeated_guest              <dbl> 0, 0, 0, 0, 0, 0, 0, 0, 0, 0, 0, 0, 0, …
$ previous_cancellations         <dbl> 0, 0, 0, 0, 0, 0, 0, 0, 0, 0, 0, 0, 0, …
$ previous_bookings_not_canceled <dbl> 0, 0, 0, 0, 0, 0, 0, 0, 0, 0, 0, 0, 0, …
$ reserved_room_type             <chr> "C", "C", "A", "A", "A", "A", "C", "C",…
$ assigned_room_type             <chr> "C", "C", "C", "A", "A", "A", "C", "C",…
$ booking_changes                <dbl> 3, 4, 0, 0, 0, 0, 0, 0, 0, 0, 0, 0, 0, …
$ deposit_type                   <chr> "No Deposit", "No Deposit", "No Deposit…
$ agent                          <chr> "NULL", "NULL", "NULL", "304", "240", "…
$ company                        <chr> "NULL", "NULL", "NULL", "NULL", "NULL",…
$ days_in_waiting_list           <dbl> 0, 0, 0, 0, 0, 0, 0, 0, 0, 0, 0, 0, 0, …
$ customer_type                  <chr> "Transient", "Transient", "Transient", …
$ adr                            <dbl> 0.00, 0.00, 75.00, 75.00, 98.00, 98.00,…
$ required_car_parking_spaces    <dbl> 0, 0, 0, 0, 0, 0, 0, 0, 0, 0, 0, 0, 0, …
$ total_of_special_requests      <dbl> 0, 0, 0, 0, 1, 1, 0, 1, 1, 0, 0, 0, 3, …
$ reservation_status             <chr> "Check-Out", "Check-Out", "Check-Out", …
$ reservation_status_date        <date> 2015-07-01, 2015-07-01, 2015-07-02, 20…
Now let’s create some basic plots (charts).
Basic ggplot charts
Hotel type, city or resort
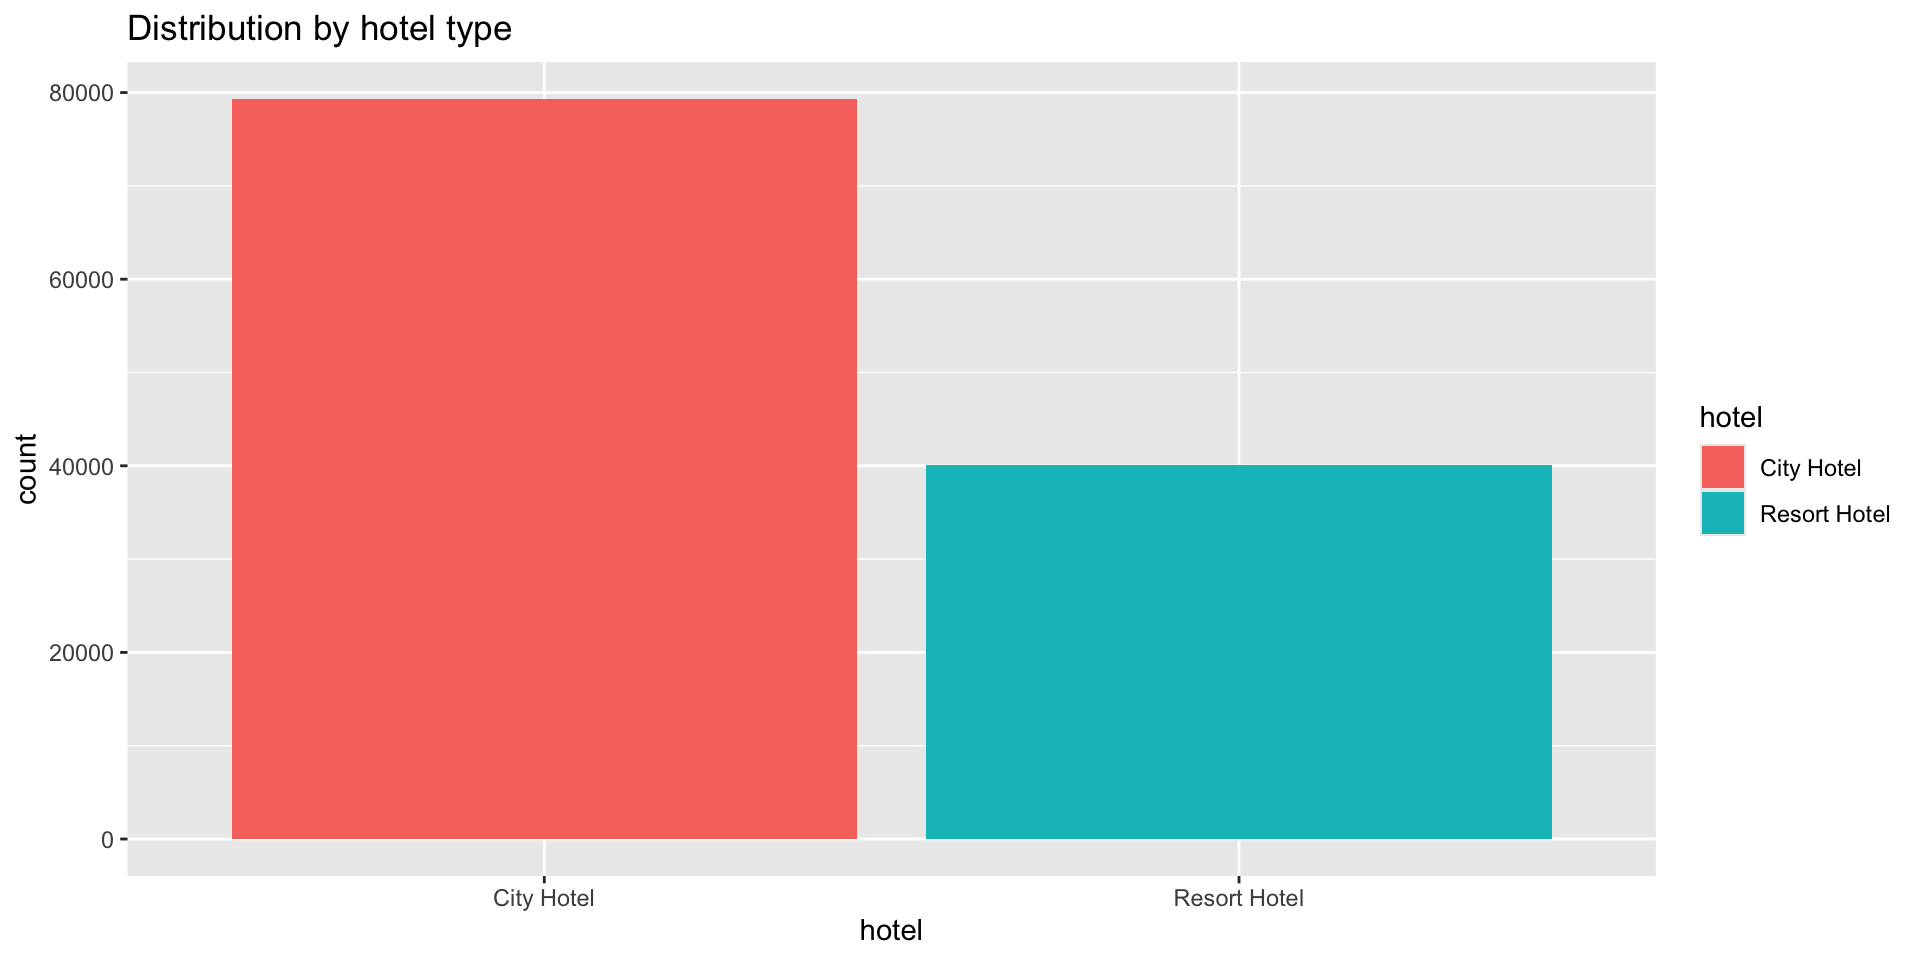
Basic ggplot charts
Hotel type, city or resort

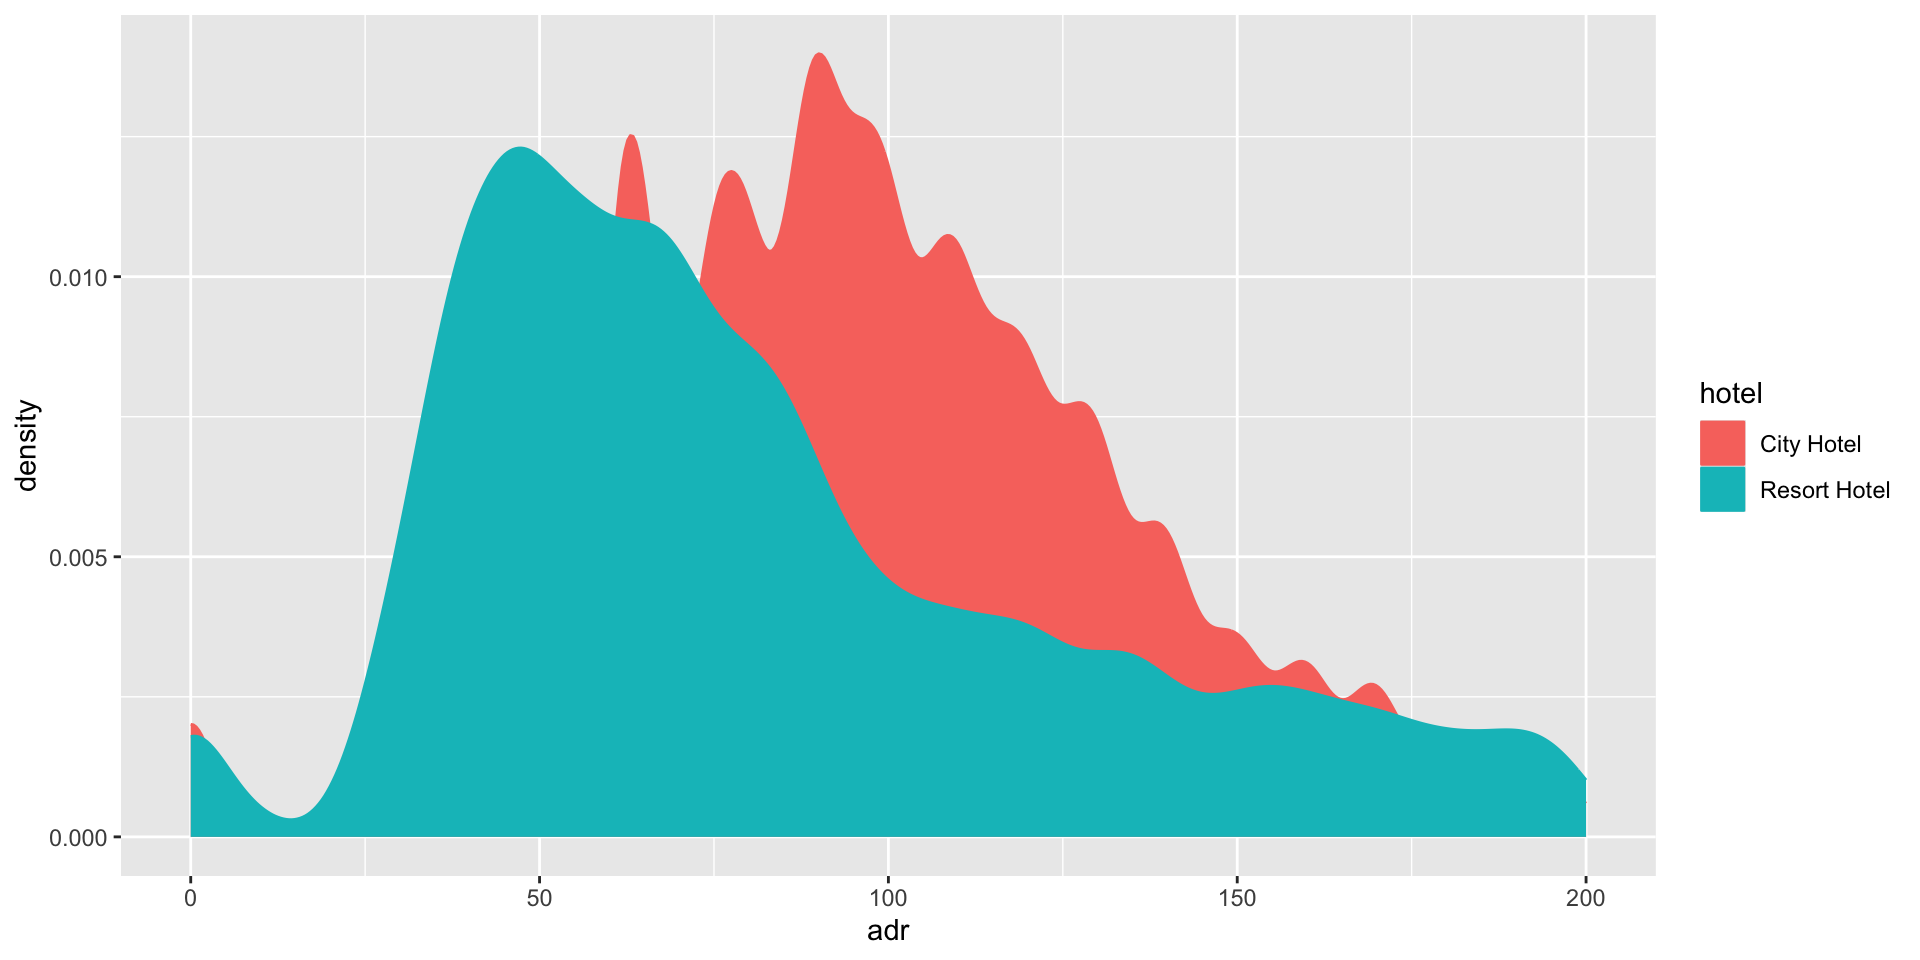
Basic ggplot charts
Average daily rate for a room by hotel type

Basic ggplot charts
Average daily rate for a room by hotel type