Chapter 7 Good Map Making Tips
7.1 Elements of a map
A map can be composed of many different map elements. They may include: Main map body, legend, title, scale indicator, orientation indicator, inset map and source and ancillary information.
Not all elements need to be present in a map. In fact, in some cases they may not be appropriate at all. A scale bar, for instance, may not be appropriate if the coordinate system used does not preserve distance across the map’s extent.
Knowing why and for whom a map is being made will dictate its layout. If it’s to be included in a paper as a figure, then parsimony should be the guiding principle. If it’s intended to be a standalone map, then additional map elements may be required.
Knowing the intended audience should also dictate what you will convey and how. If it’s a general audience with little technical expertise then a simpler presentation may be in order. If the audience is well versed in the topic, then the map may be more complex.
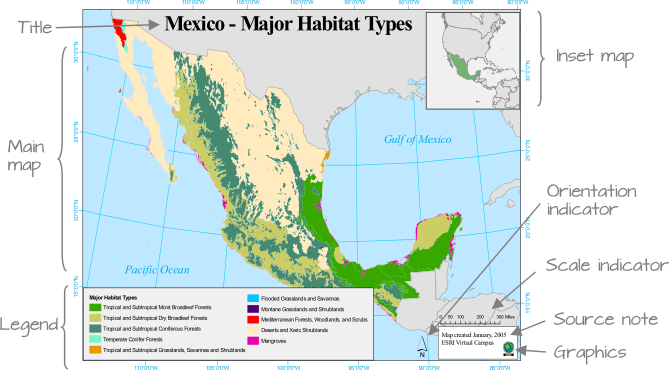
Figure 7.1: Map elements. Note that not all elements are needed, nor are they appropriate in some cases. Can you identify at least one element that does not belong in the map (hint, note the orientation of the longitudinal lines; are they parallel to one another? What implication does this have on the North direction and the placement of the North arrow?)
7.2 How to create a good map
Here’s an example of a map layout that showcases several bad practices.
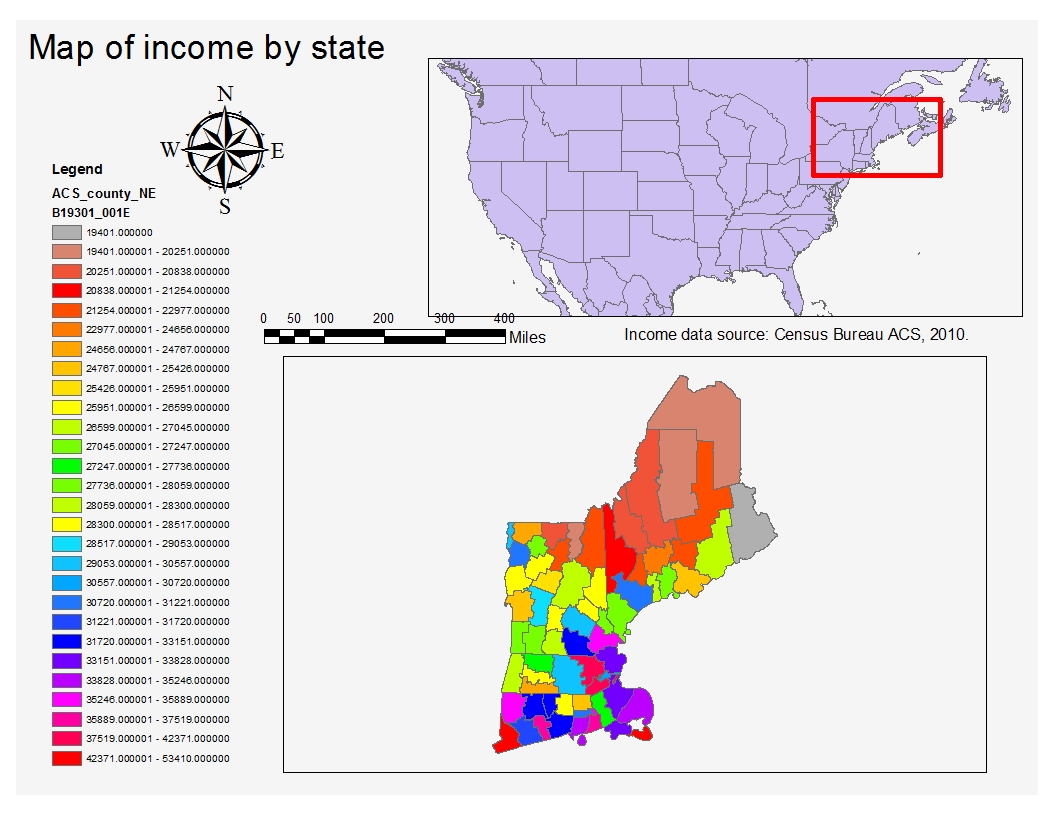
Figure 7.2: Example of a bad map. Can you identify the problematic elements in this map?
A good map establishes a visual hierarchy that ensures that the most important elements are at the top of this hierarchy and the least important are at the bottom. Typically, the top elements should consist of the main map body, the title (if this is a standalone map) and a legend (when appropriate).
When showcasing Choropleth maps, it’s best to limit the color swatches to less than a dozen–it becomes difficult for the viewer to tie too many different colors in a map to a color swatch element in the legend. Also, classification breaks should not be chosen at random but should be chosen carefully; for example adopting a quantile classifications scheme to maximize the inclusion of the different color swatches in the map; or a classification system designed based on logical breaks (or easy to interpret breaks) when dictated by theory or cultural predisposition.
Scale bars and north arrows should be used judiciously and need not be present in every map. These elements are used to measure orientation and distances. Such elements are critical in reference maps such as USGS Topo maps and navigation maps but serve little purpose in a thematic map where the goal is to highlight differences between aerial units. If, however, these elements are to be placed in a thematic map, reduce their visual prominence (see Figure 7.3 for examples of scale bars). The same principle applies to the selection of an orientation indicator (north arrow) element. Use a small north arrow design if it is to be placed low in the hierarchy, larger if it is to be used as a reference (such as a nautical chart).
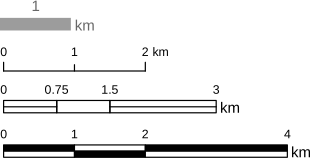
Figure 7.3: Scale bar designs from simplest (top) to more complex (bottom). Use the simpler design if it’s to be placed low in the visual hierarchy.
- Title and other text elements should be concise and to the point. If the map is to be embedded in a write-up such as a journal article, book or web page, title and text(s) elements should be omitted in favor of figure captions and written description in the accompanying text.
Following the aforementioned guidelines can go a long way in producing a good map. Here, a divergent color scheme is chosen whereby the two hues converge to the median income value. A coordinate system that minimizes distance error measurements and that preserves “north” orientation across the main map’s extent is chosen since a scale bar and north arrow are present in the map. The inset map (lower left map body) is placed lower in the visual hierarchy and could be omitted if the intended audience was familiar with the New England area. A unique (and unconventional) legend orders the color swatches in the order in which they appear in the map (i.e. following a strong north-south income gradient).
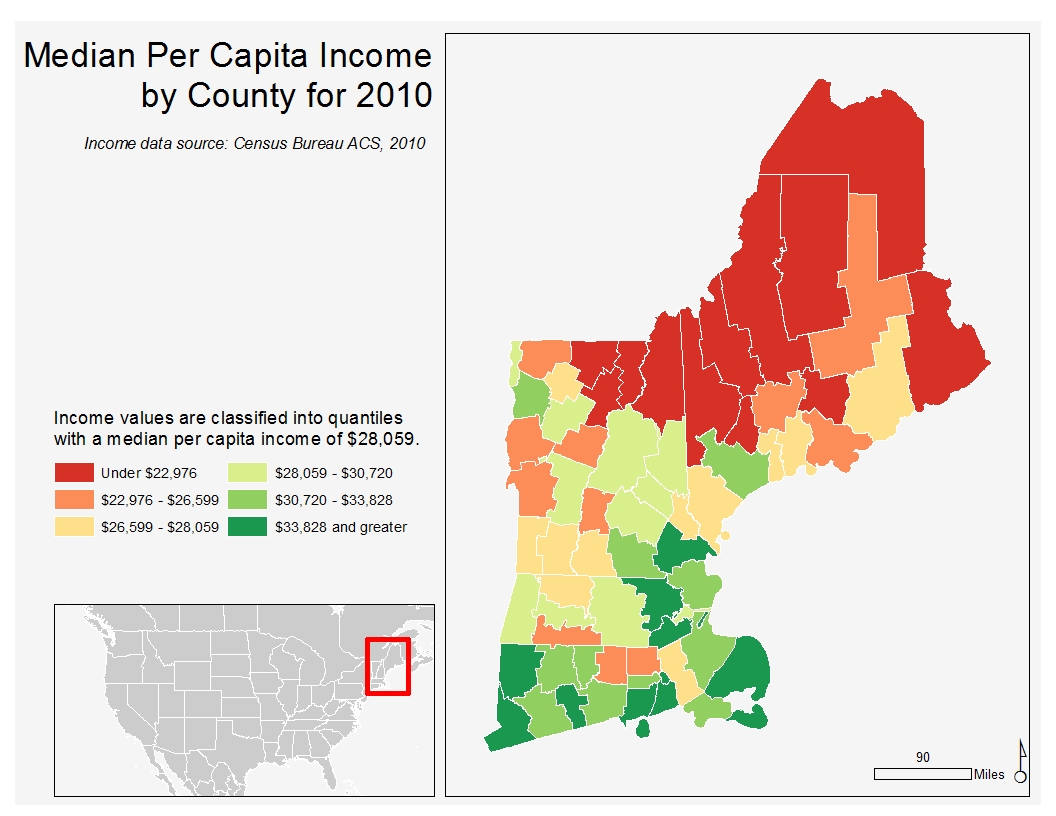
Figure 7.4: Example of an improved map.
7.3 Typefaces and Fonts
Maps may include text elements such as labels and ancillary text blocks. The choice of typeface (font family) and font (size, weight and style of a typeface) can impact the legibility of the map. A rule of thumb is to limit the number of fonts to two: a serif and a sans serif font.

Figure 7.5: Serif fonts are characterized by brush strokes at the letter tips (circled in red in the figure). Sans Serif fonts are devoid of brush strokes.
Serif fonts are generally used to label natural features such as mountain ridges and water body names. Sans serif fonts are usually used to label anthropogenic features such as roads, cities and countries.
Varying the typeset size across the map should be avoided unless a visual hierarchy of labels is desired. You also may want to stick with a single font color across the map unless the differences in categories need to be emphasized. In the following example, a snapshot of a map before (left) and after (right) highlight how manipulating typeset colors and styles (i.e. italic, bold) can have a desirable effect if done properly.
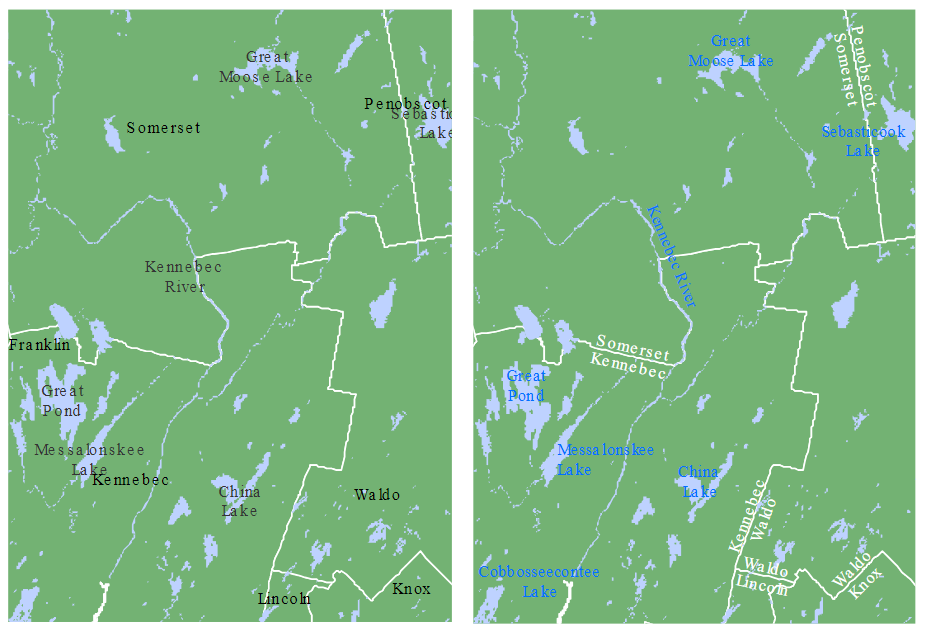
Figure 7.6: The lack of typeset differences makes the map on the left difficult to differentiate county names from lake/river names. The judicious use of font colors and style on the right facilitate the separation of features.
7.4 A readable map that tells a clear story
A reader should be able to understand a map and determine the quality of the data being presented as evidence or telling the story you seek to communicate. Review the exported figure at its intended reading size by exporting the image or PDF of the map layout and opening the file to inspect map elements.
A layout organizes map frames, legends, labels and source information for an audience. Comparative figures may use several frames in a map layout or maps exported consistently and assembled in another document. Either approach requires checking that the intended variables, extents, projections and symbols survive the final export.
A data source profile describes the dataset; a field dictionary describes its variables. Record the final map settings in your research log, and explain why you chose to symbolize the features as such.
A checklist for reviewing a finished map before submitting
Make sure the following are clear to the audience when they view your map layout. Use the map title, subtitle, legend, data citation, and/or labels to make these aspects clear.
What is the attribute, variable, measure being mapped? Name the numerator, denominator, units (e.g., population, housing units, etc.), geography (e.g., Census Tracts, Counties, watershed, country), and the time period. For example: “For-rent units as a percentage of all housing units, 2020–2024 ACS” is more informative and appropriate than “Rental vacancy.”
What comparisons are possible, or not? If comparing magnitudes of numeric values across maps, hold the extent, map projection, numeric class breaks, and colors constant.
What are your trying to communicate or make legible? Inspect the map features and symbology at the size your audience will see by exporting and opening the file. Keep boundaries and the basemap detail from overpowering the data, or remove them. Check color contrast and be sure to distinguish missing data (NAs) from zero.
Is the map accessible? Accompany each figure with a short text description of its main pattern and limits. This can be placed as a text annotation on the map itself or in a document that includes your maps. Include exact values for key comparisons so the argument does not depend entirely on distinguishing and inferring patterns from differences in colors or shading.
Is the data source provenance clear? Provide a readable data source citation so that anyone viewing your map can easily identify and locate your data sources. In your research log and then in the final report document, place the complete data source, date or time period represented, attribute field or variable definitions, and geoprocessing steps in the accompanying data source and methods sections.
What can you claim or argue for with your map? Include sampling uncertainty and acknowledge what a map can and cannot establish about the content being mapped.