R Basics and Problem Solving
Intro to Data Analytics
Topics
Corresponds to IDS 2.1-2.5 and IMS Ch 1
Review creating objects
Getting help
The working directory
Data types
Data frames
The accessor
$Vectors
Coercion
Getting started
First, open up your RStudio project folder (e.g.,
data121) and select the .Rproj file for the course to open RStudio. Alternatively, open RStudio and use the drop down list in the upper right corner to select your RStudio project.Next, create a new Quarto Document in your
/activitiesfolder for today’s in-class activity calledRbasics-2-activity.qmd
Storing information in objects
- You can think of objects as boxes that store things. To create an object, we have to ask R to take the results of some code and assign those results to an object.
Create a vector using the concatenate function c() that contains your top three favorite colors:
colors <- c("fern green", "tangerine", "iris")
Interpreting error messages
- Errors
-
Terminate a process that we are trying to run in R. They arise when it is not possible for R to continue evaluating a function.
- Warnings
-
Don’t terminate a process but are meant to warn us that there may be an issue with our code and its output. They arise when R recognizes potential problems with the code we’ve supplied.
- Messages
-
Also don’t terminate a process and don’t necessarily indicate a problem but simply provide us with more potentially helpful information about the code we’ve supplied.
Use the output to solve the issue
Referencing resources
There are a number of resources available to help you recall how certain functions work and answer questions that come up while working in R:
Search Google, Stack Overflow (include terms like “base R <insert your question/issue>)
See the syllabus for more reference texts
Help in RStudio
Using the Help pane
help()?
Create a new code chunk in your Quarto and try using both to learn about a function.
- The
args()function
args(log)
Try it with the sum() function.
The working directory
Why? R needs to know where your files are located. You make this easier by working from a single RStudio project for tutorials in this class.
getwd()
The working directory when rendering a Quarto
Note: Quarto documents have their own working directory WHEN your are rendering.
paths.txt example
Data types
In R output we’ll see: Numeric
numor characterchrTypes of numeric data:
Numerical: measurements (e.g., ratios, percentages, intervals)
Categorical: counting (e.g., ranking scales, names or categories with no quantitative information)
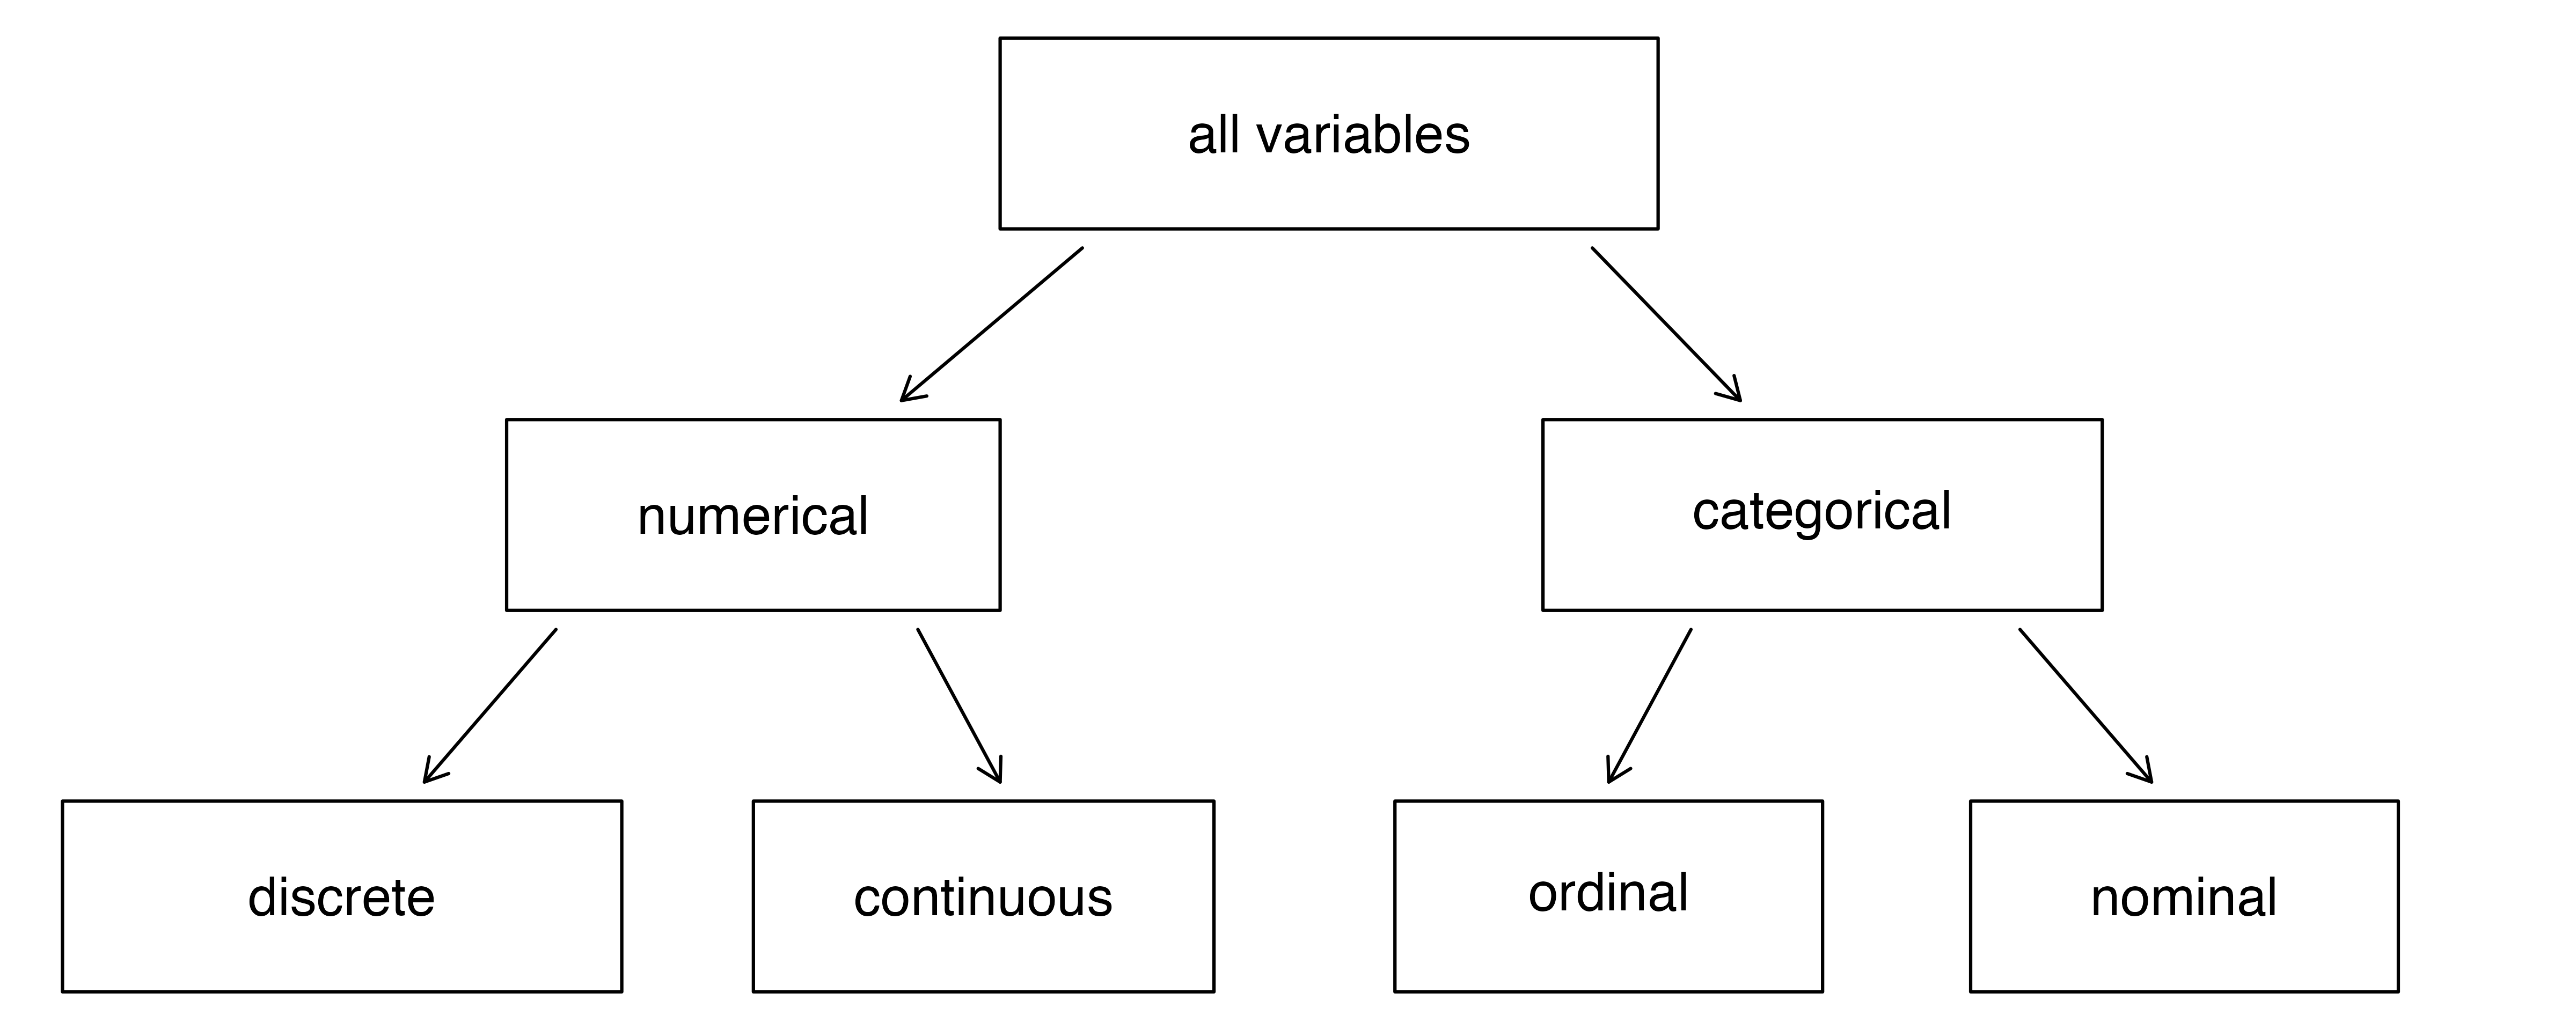
Data can be broken down into four types:
Nominal data which have no implied order, size, or quantitative information (species type, place names, etc.)
Ordinal data have an implied order (e.g. ranked scores, likert score).
Discrete data that can only take on whole, countable values or intervals.
Continuous that can take on any numeric value
Working with data types
- Create a new code chunk in your Quarto
- Create several new objects of different types: numeric and character
- Check the type of objects you created using the
class()function
- Check the structure of the objects using the
str()function
Working with data types continued…
- Load the tidyverse package of packages
library(tidyverse) - Load the package that contains data for the IDS textbook:
library(dslabs)
*Note: this should already by installed based on work you did for an earlier lab.
- Use the
data()function to display the data sets available to you in the dslabs package. - Load the
murdersdata using thedata()function. - Check the class of the data set.
- Check the structure of the object.
Data frames
Used to represent a tabular spreadsheet
It is considered “tidy data” when each row is a unique observation and each column is a variable
- Use the
head()function to explore themurdersobject. - Open in a table from the Environment pane.
- Open in a table using the
view()function. - Use
glimpse()from the tidyverse to learn more about the structure of the data frame.
Data frames
Create a table in R using data.frame() or tibble()
- Create a vector object called
popcontaining the total population variable from themurdersdata frame object. - Create vector with the total number of murders called
count_murders - Use the
data.frame()function to place these two vectors into a data frame calledrate_df - Use the
tibble()function to place these two vectors into a tibblerate_tibble - Create a new variable called
rate_per1000that contains that result of calculating (count_murders/pop)*1000
The accessor $
Use $ to access the different variables represented by columns in a data frame.
- Access the
regionscolumn inmurders - Use the
names()function to see all of the columns inmurders
The accessor [[]]
Use [[]] to access the different variables represented by columns in a data frame.
- Access the
totalcolumn in themurdersdata frame. This contains the total number of murders in a state. - Use the
names()function to see all of the columns inmurders
Vectors
- Objects with several entries (like a column in a spreadsheet)
- Access the
populationcolumn inmurders - Add the result to an object called
pop - Use
length()to figure out how many entries “rows” are in the column
Creating a vector with names
- Create a vector object
statethat contains the name of three US states: New York, Missouri, and Kansas - Create a vector object,
codes, with the following state id codes: 36, 29, 20 - Create a named vector object,
states, with the following state id codes and names:
c("New York" = 36, "Missouri" = 29, "Kansas" = 20)
Subsetting
We use square brackets to access specific elements of a vector.
- Subset the
statesvector object by position using[] - Use
:to subset the object to only the last two entries - Access the New York entry by using the name of the entry
Coercion
When data does not match what R expects, functions try to guess what was meant without throwing an error message.
- Create a vector
x <- c(1, "Missouri", 3)and check the class of the object - Create a vector of the sequence 1 through 8.
- Check the class of the object
- Coerce the vector from numeric to character using
as.character - Coerce it back to numeric using
as.numeric
- Coerce the vector from numeric to character using
- Check the class of the object
- Coerce the
xobject to numeric. What happens?