Introduction to Data Analytics & R Programming
Welcome!
“There is nothing in the realm of work — no matter how interesting or exciting or desired — that does not entail, at some point, the experience of frustration, self-doubt, loneliness, and anxiety. Experiences that most of us (realistically, all of us) flee from, especially when we’re by ourselves. Our goal shouldn’t be to eliminate this discomfort. We need to teach students that it’s part of the process, and develop strategies for coping with it. But for students to really get that — to believe it, to feel it — they have to do the work.” (The End of the Take-Home Essay?” in The Chronicle of Higher Education; edited for brevity.)
Course FAQ
Q - What data science background does this course assume?
A - None.
Q - Is this an intro stat course?
A - While statistics \(\ne\) data science, they are very closely related and have tremendous of overlap. Hence, this course is a great way to get started with statistics. However, this course is not your typical high school statistics course.
Q - Will we be doing computing?
A - Yes.
Course FAQ
Q - Is this an intro CS course?
A - No, but many themes are shared.
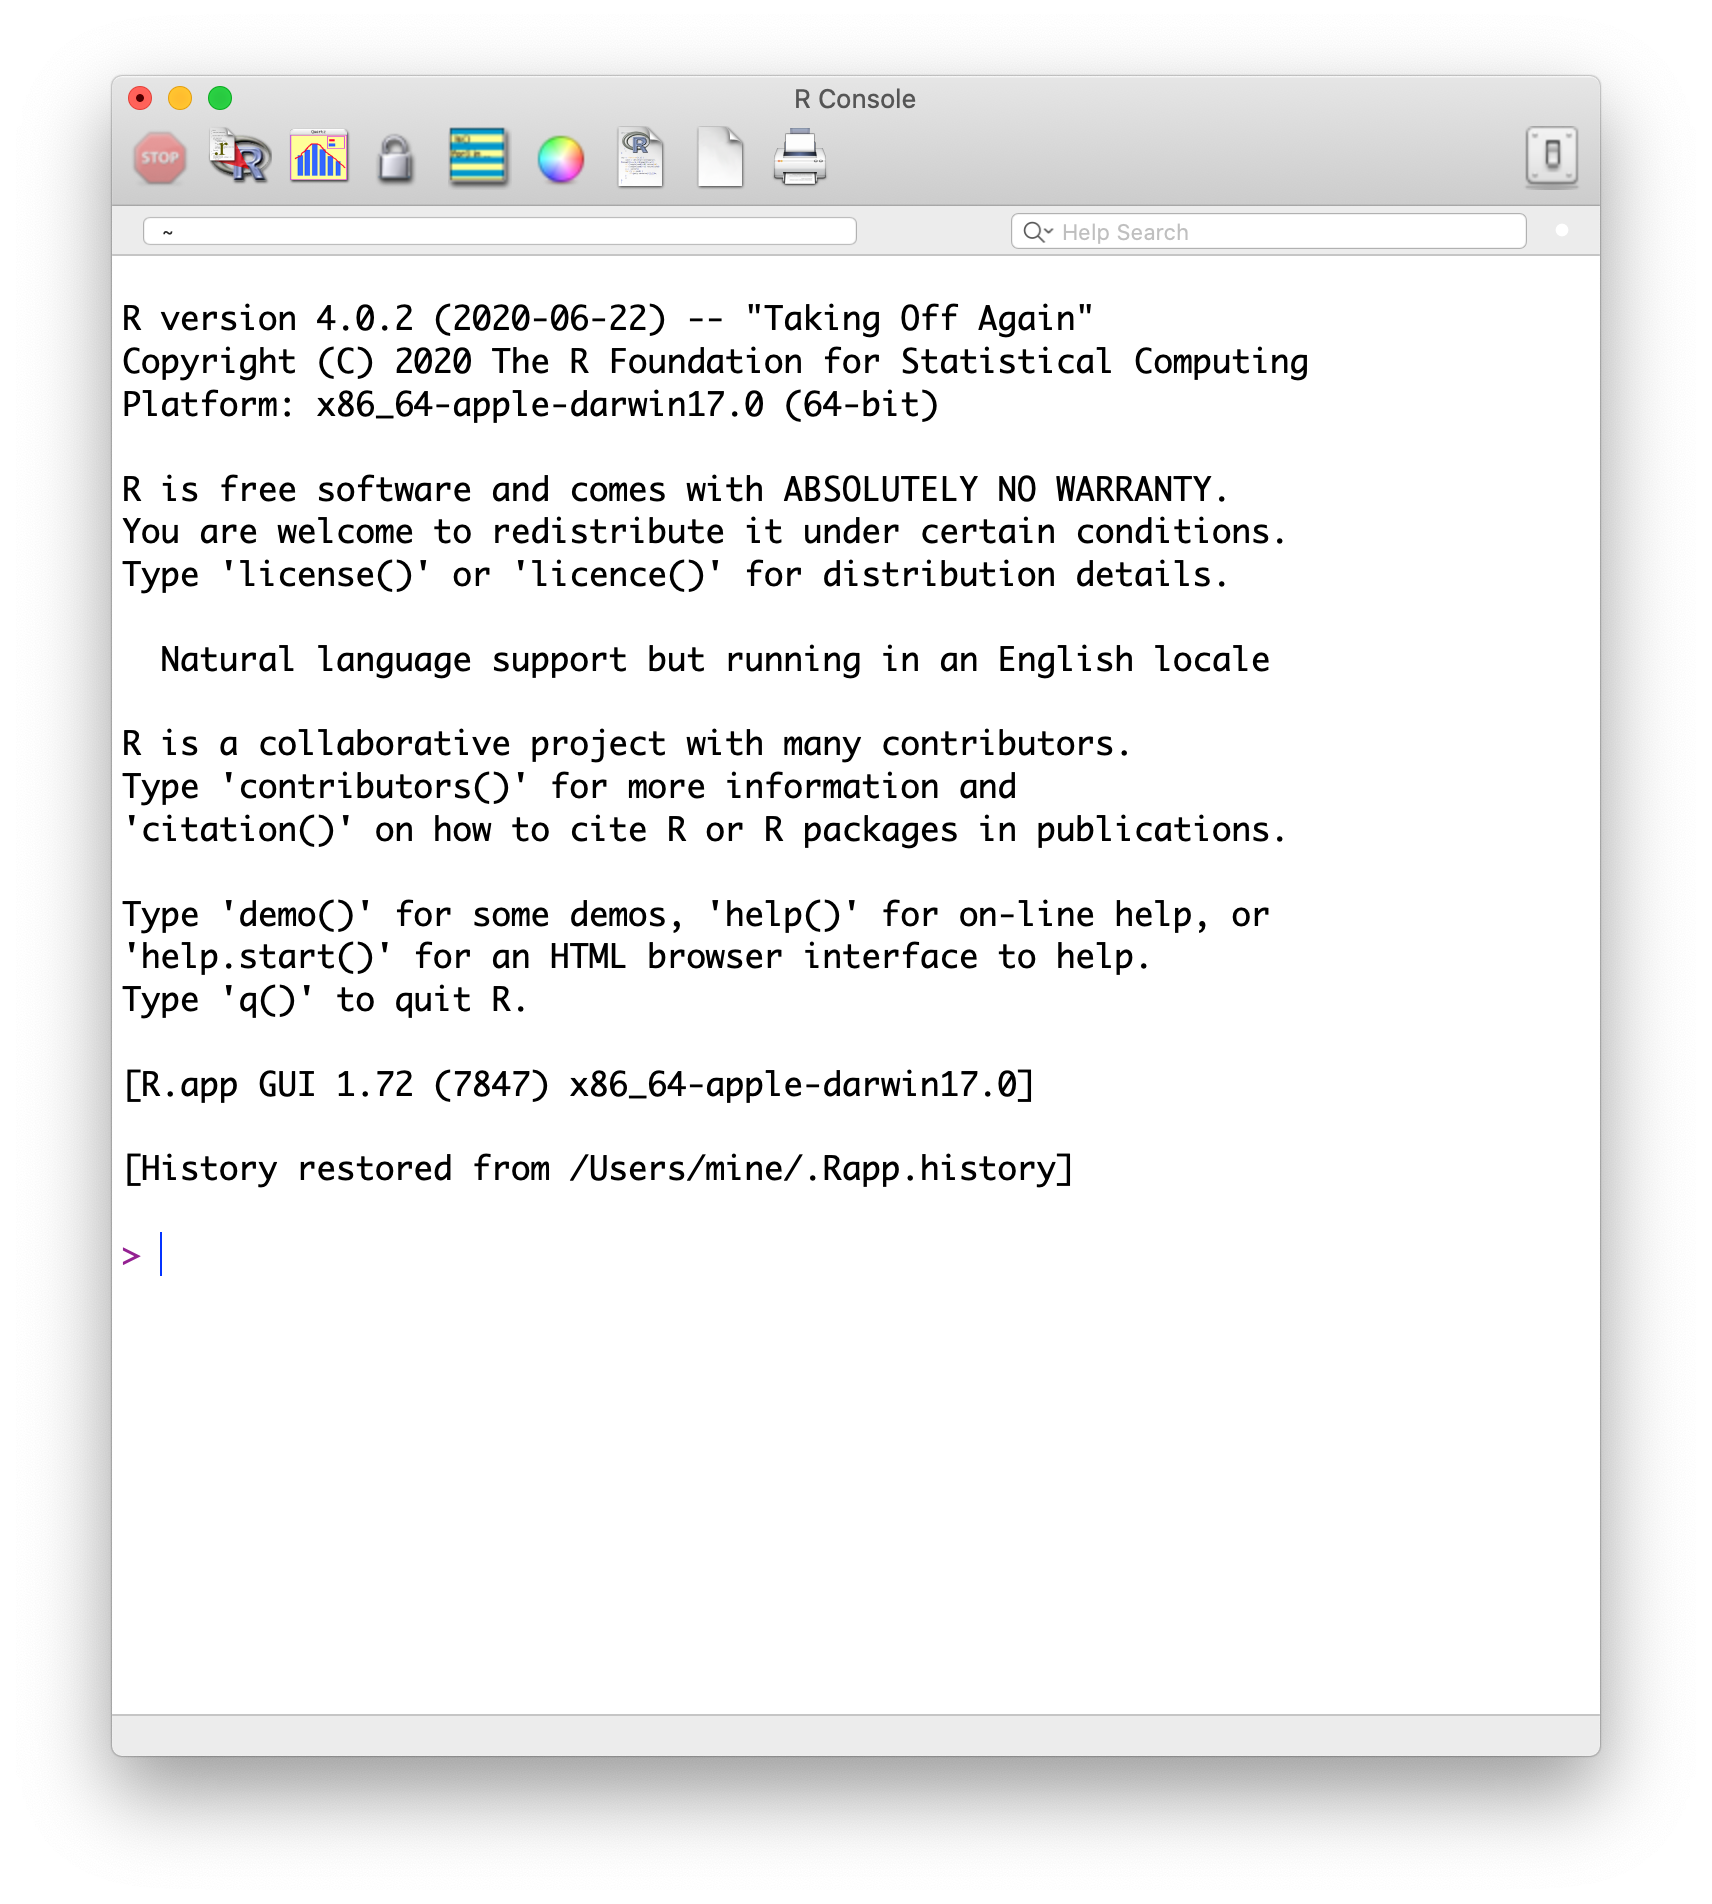
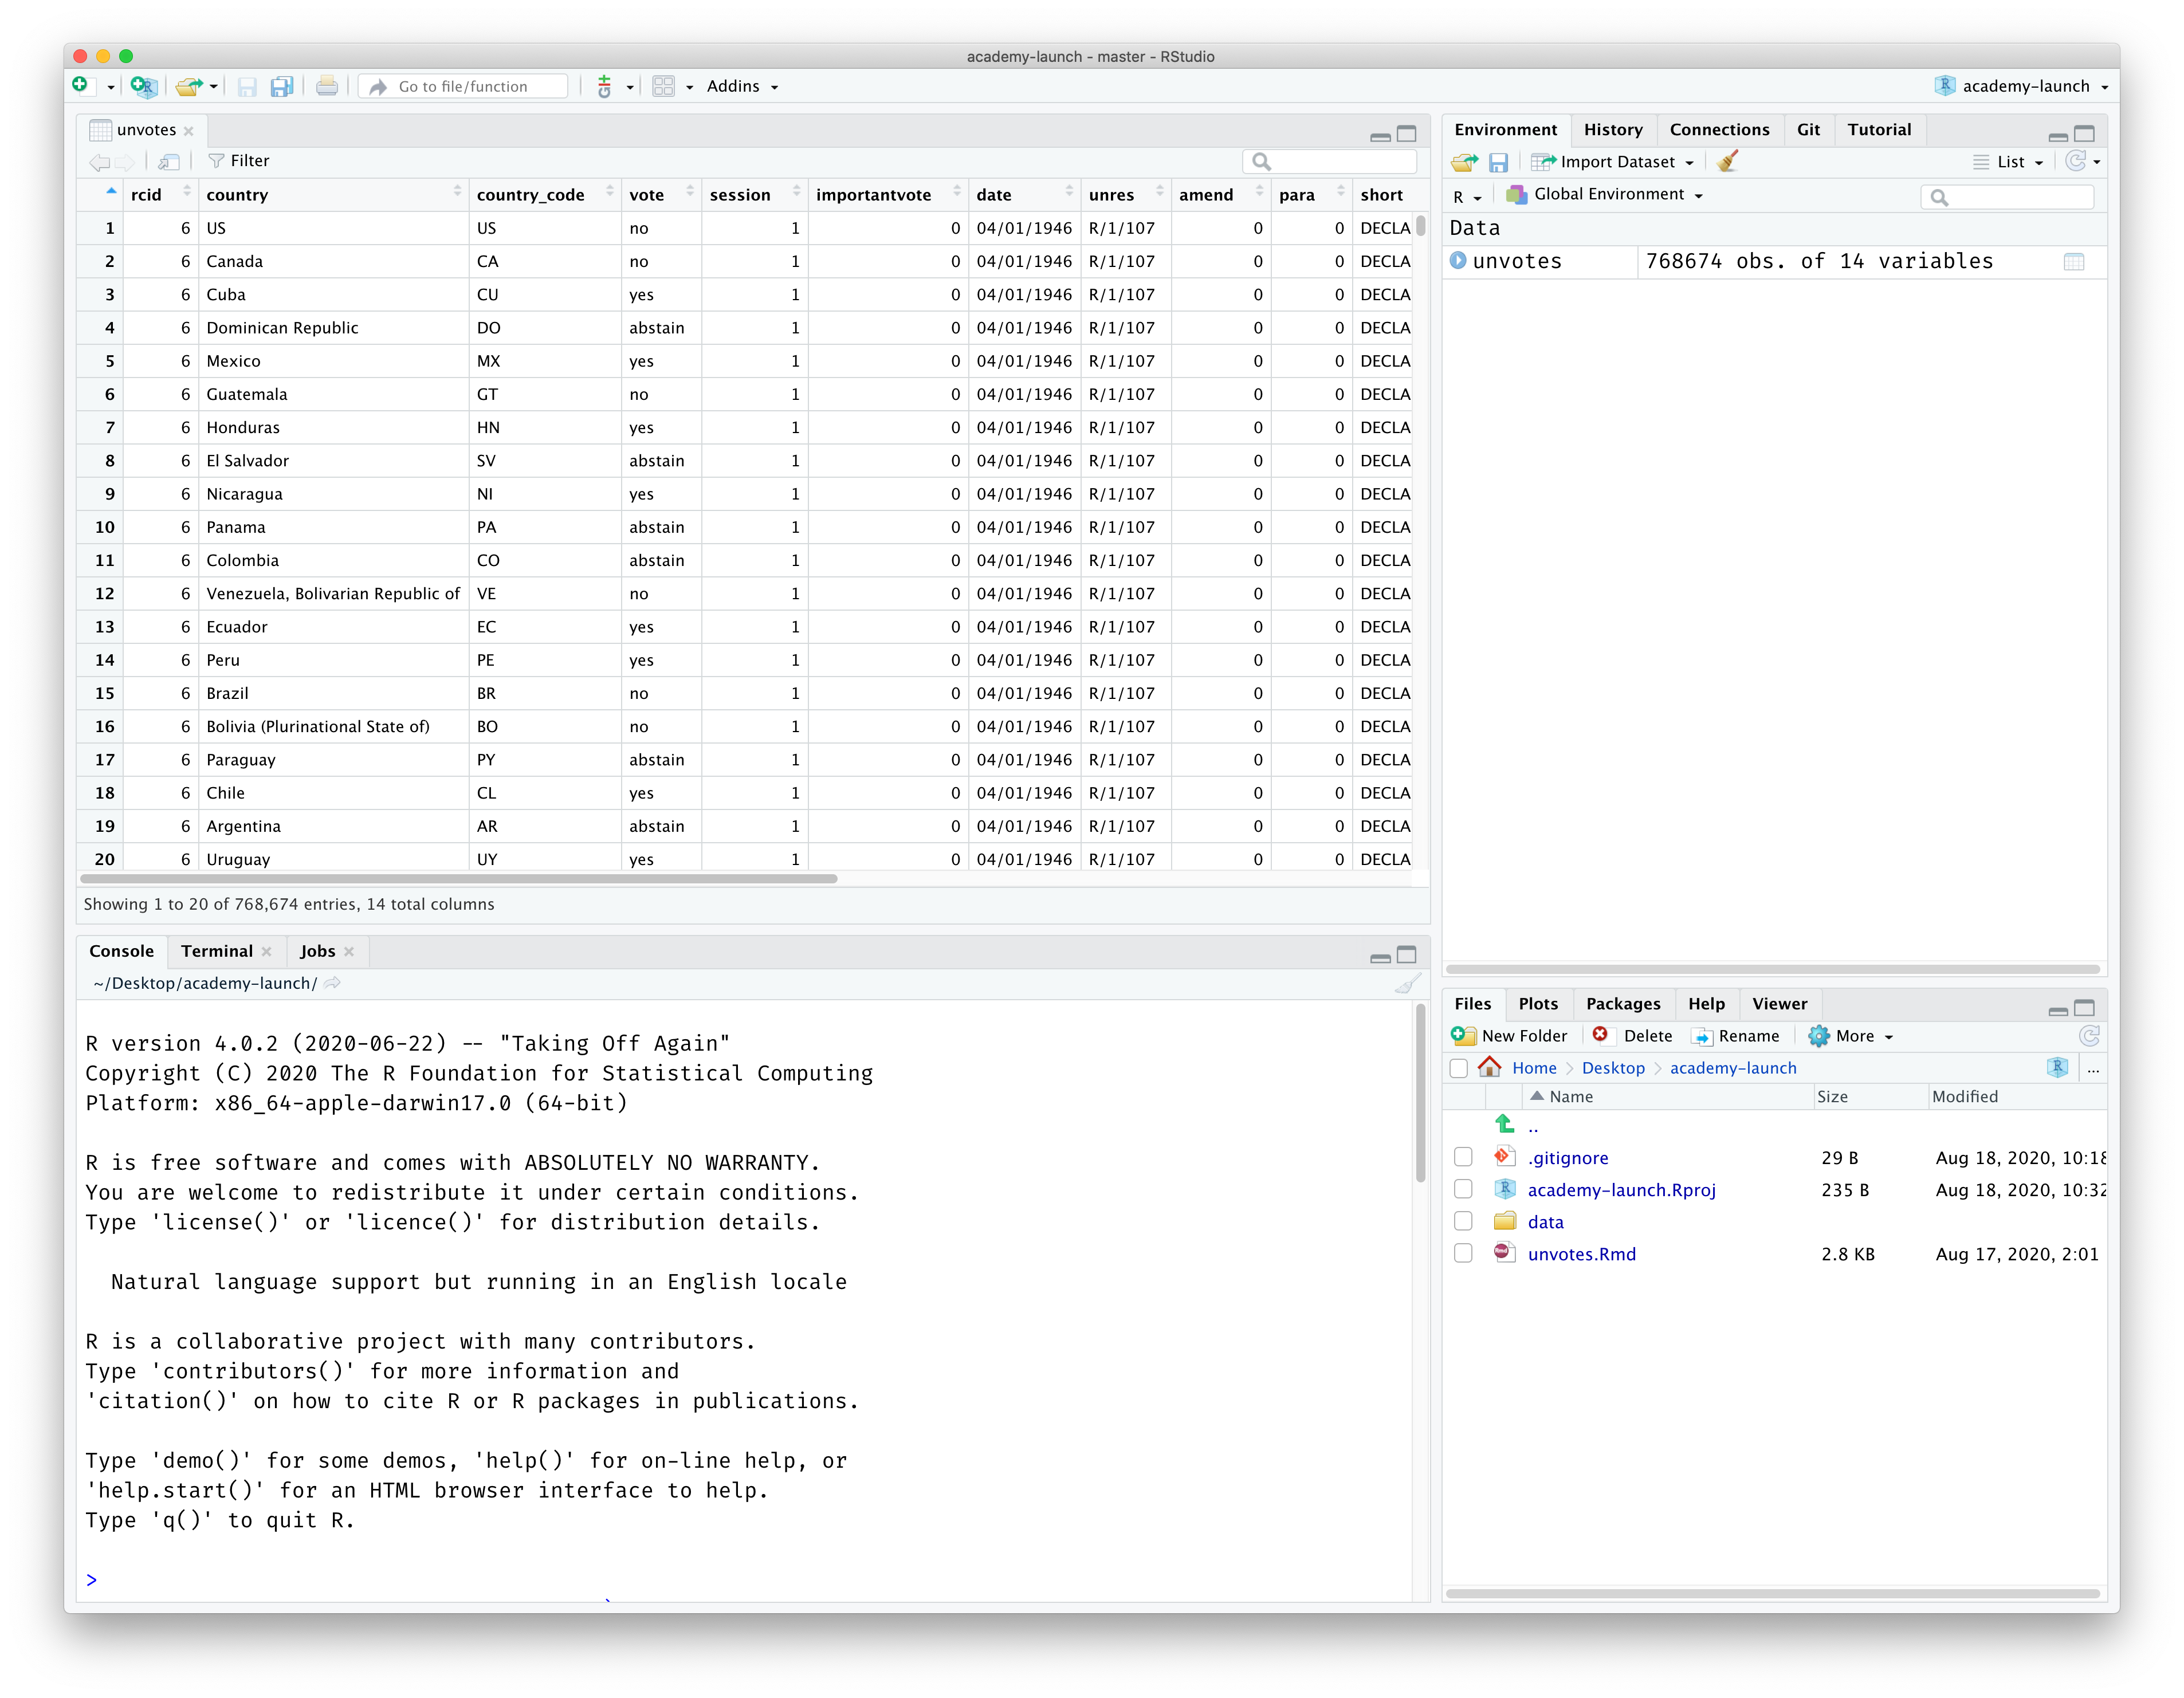
Q - What computing language will we learn?
A - R.
Q: Why not language X?
A: We can talk about that some time if you want.
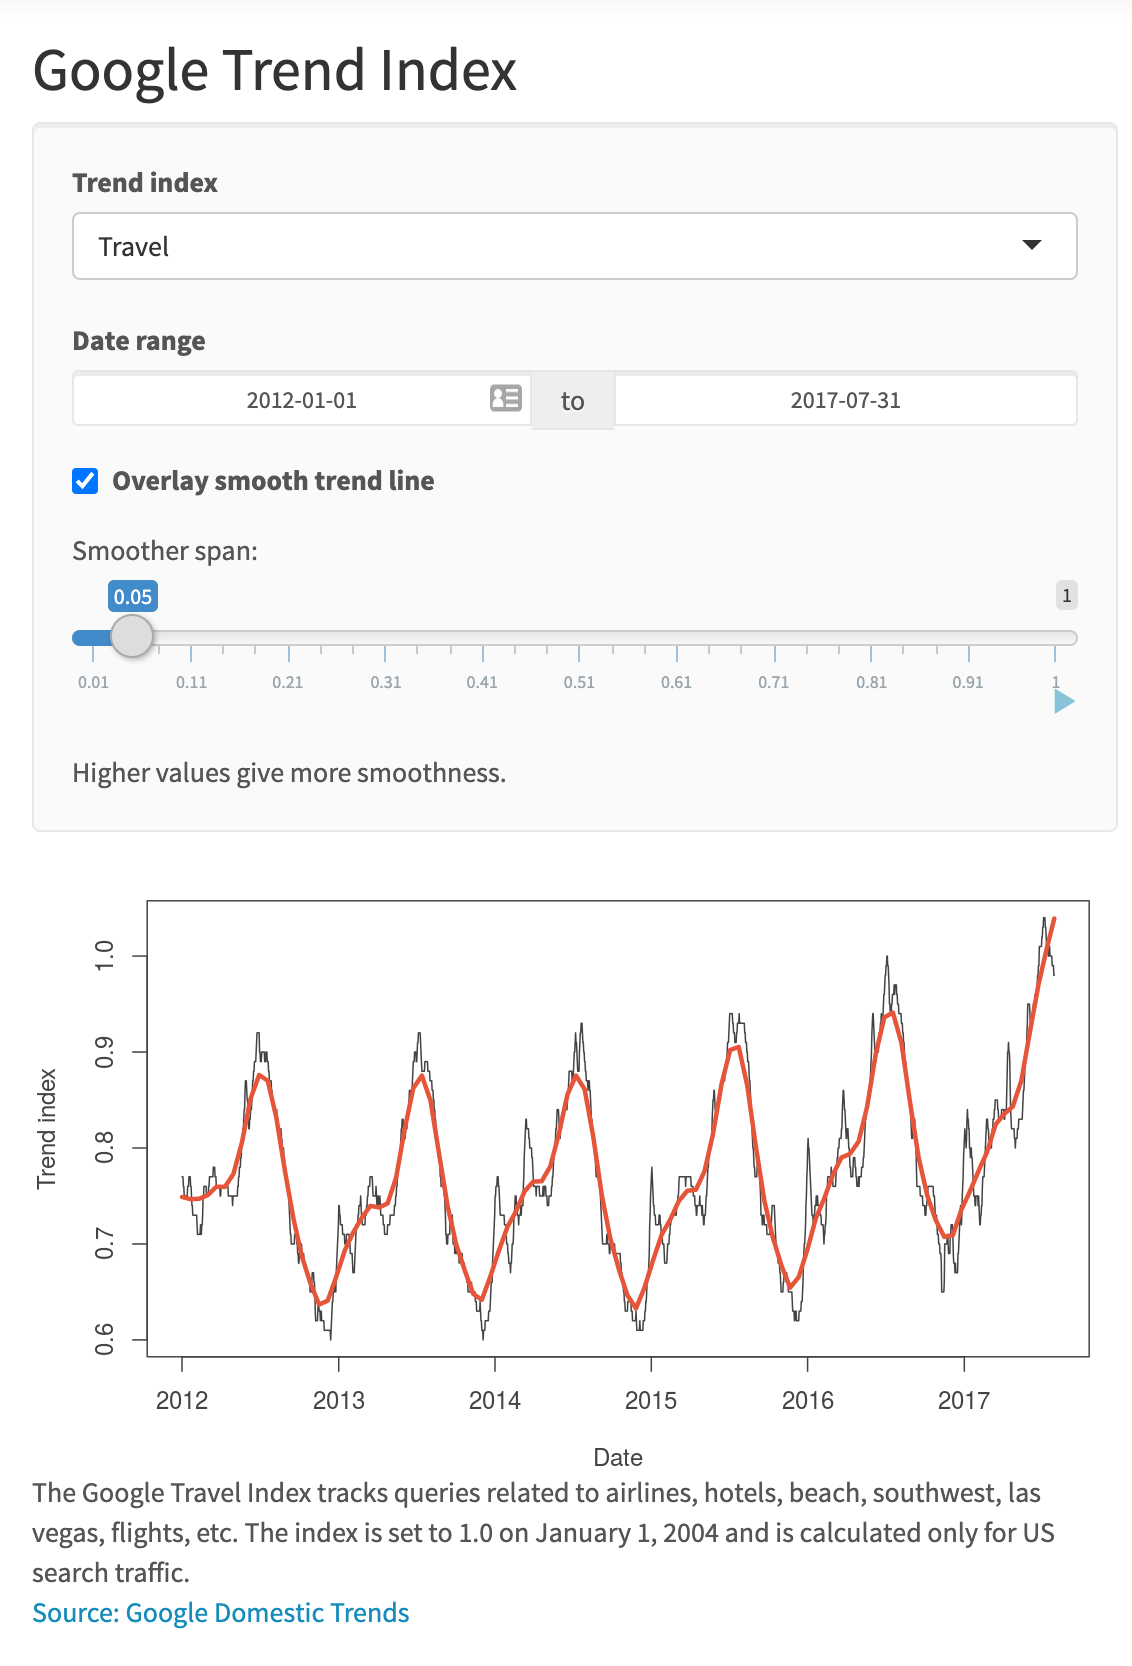
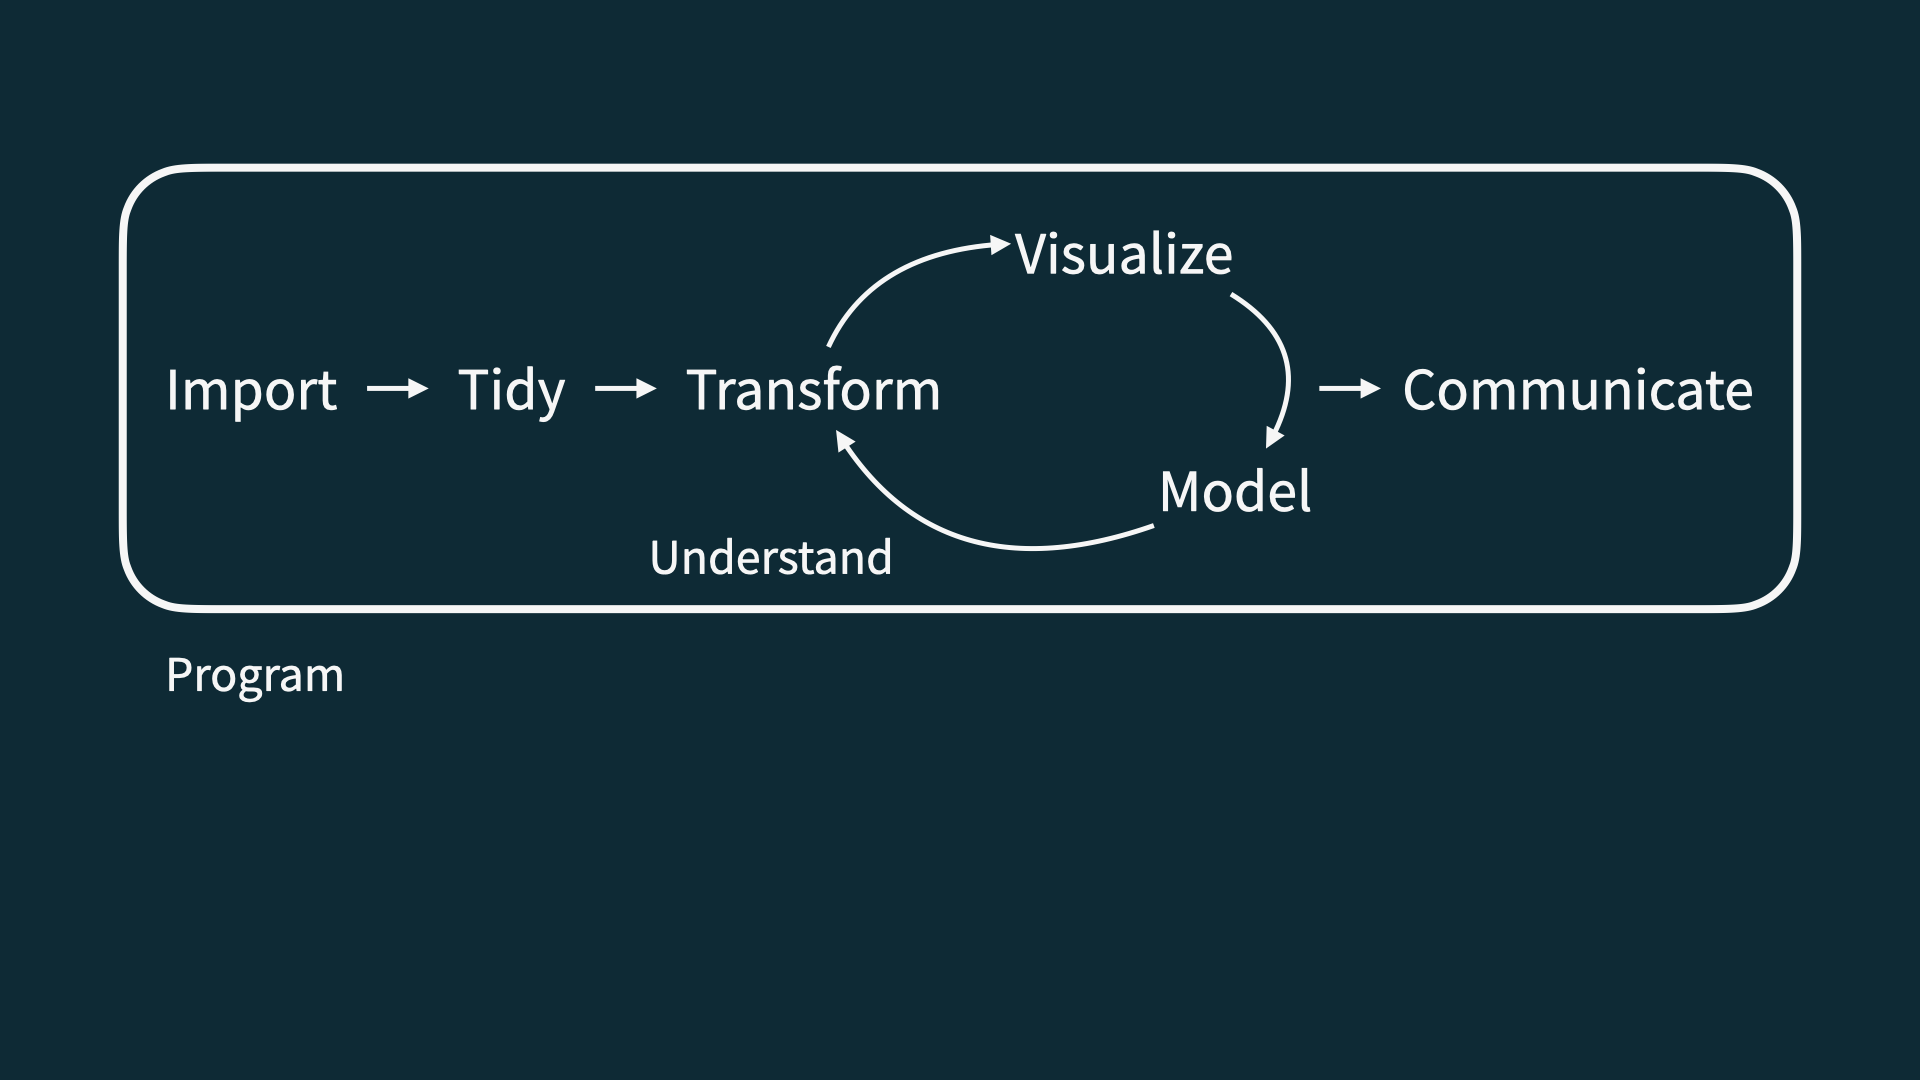
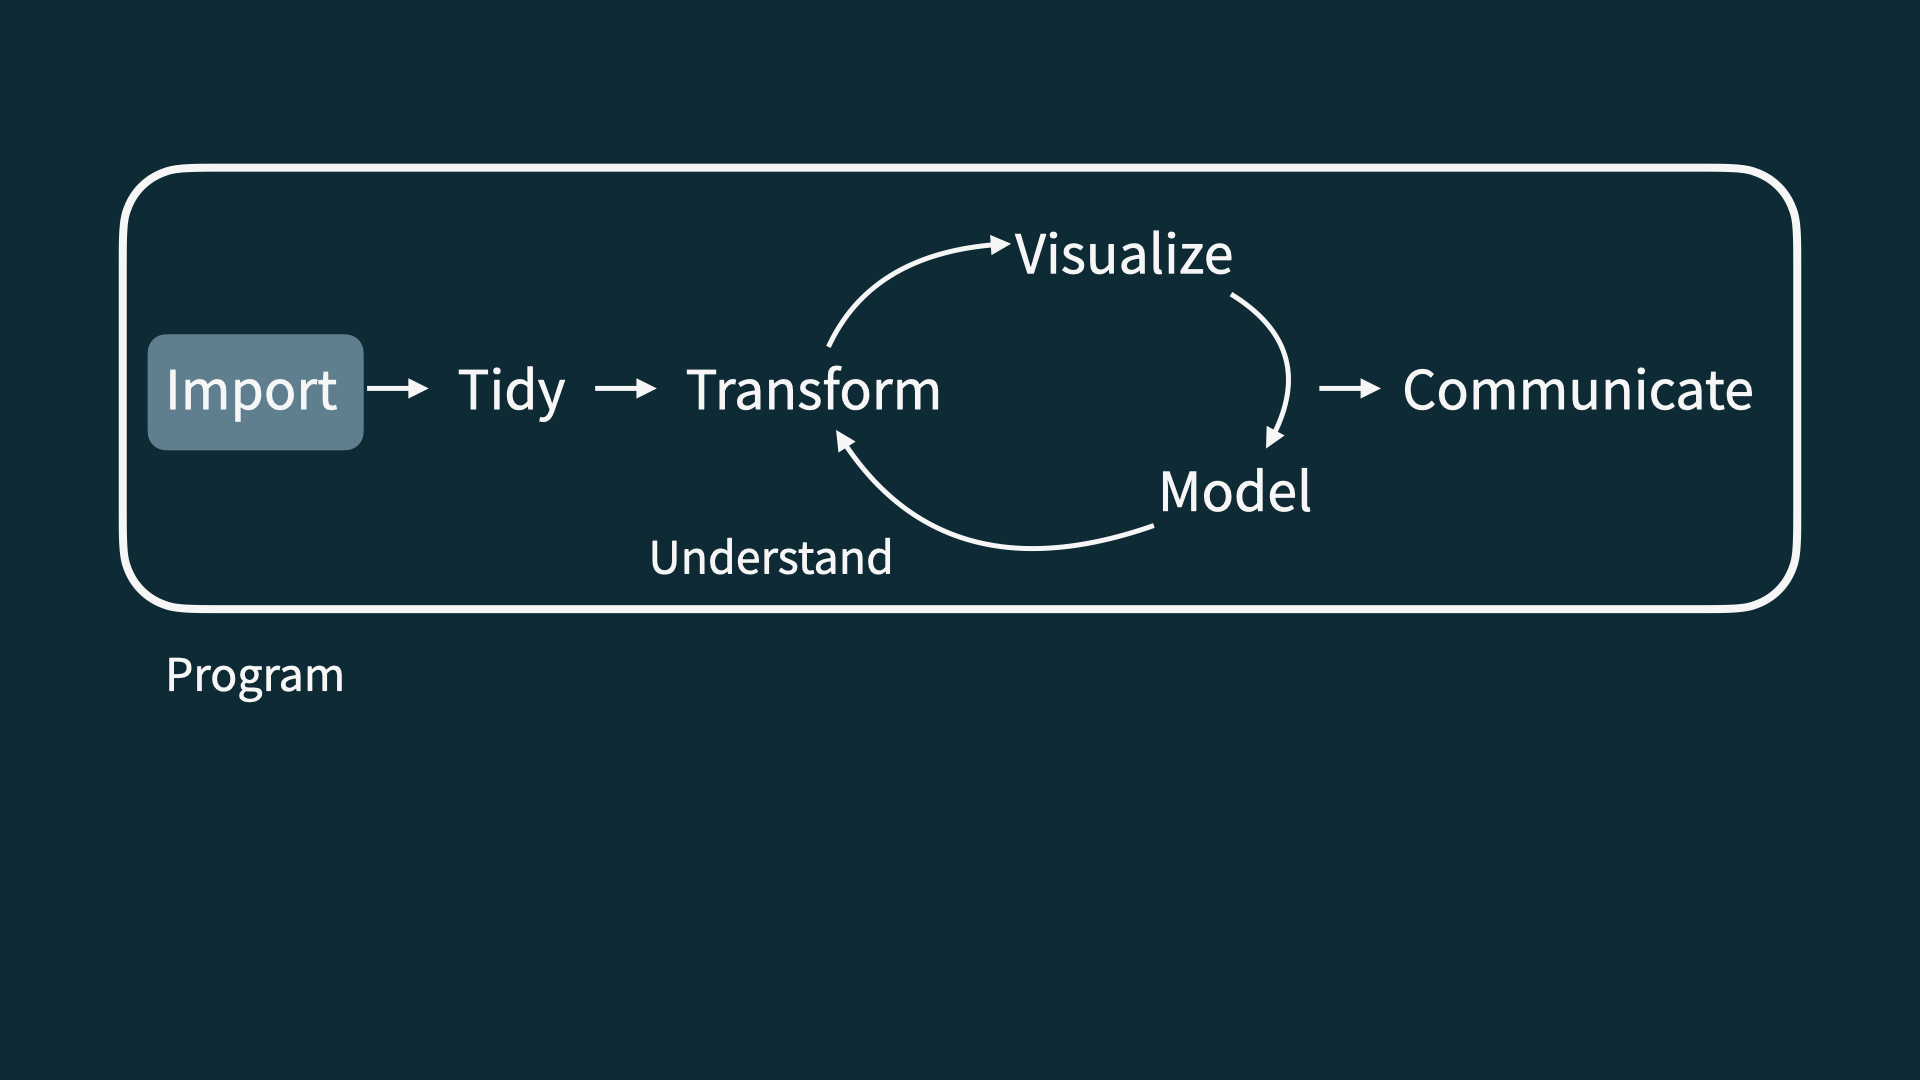
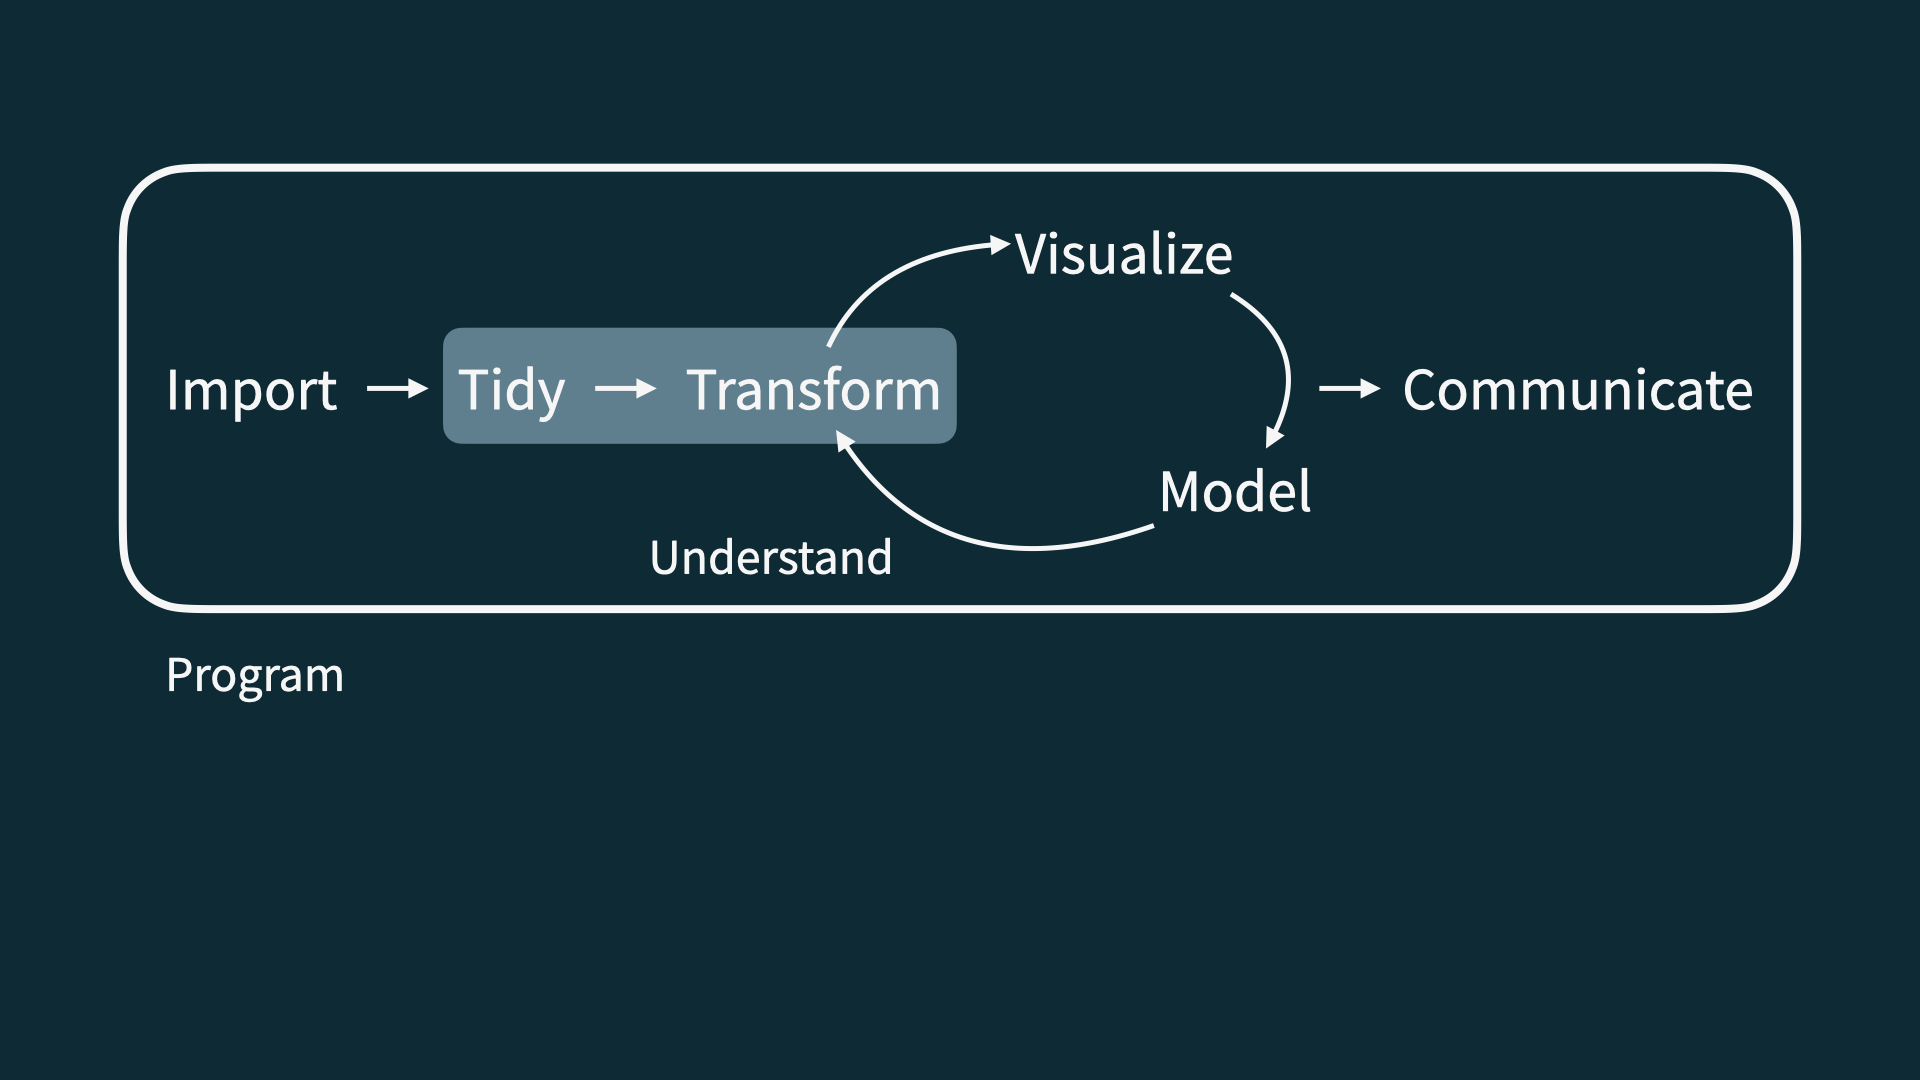
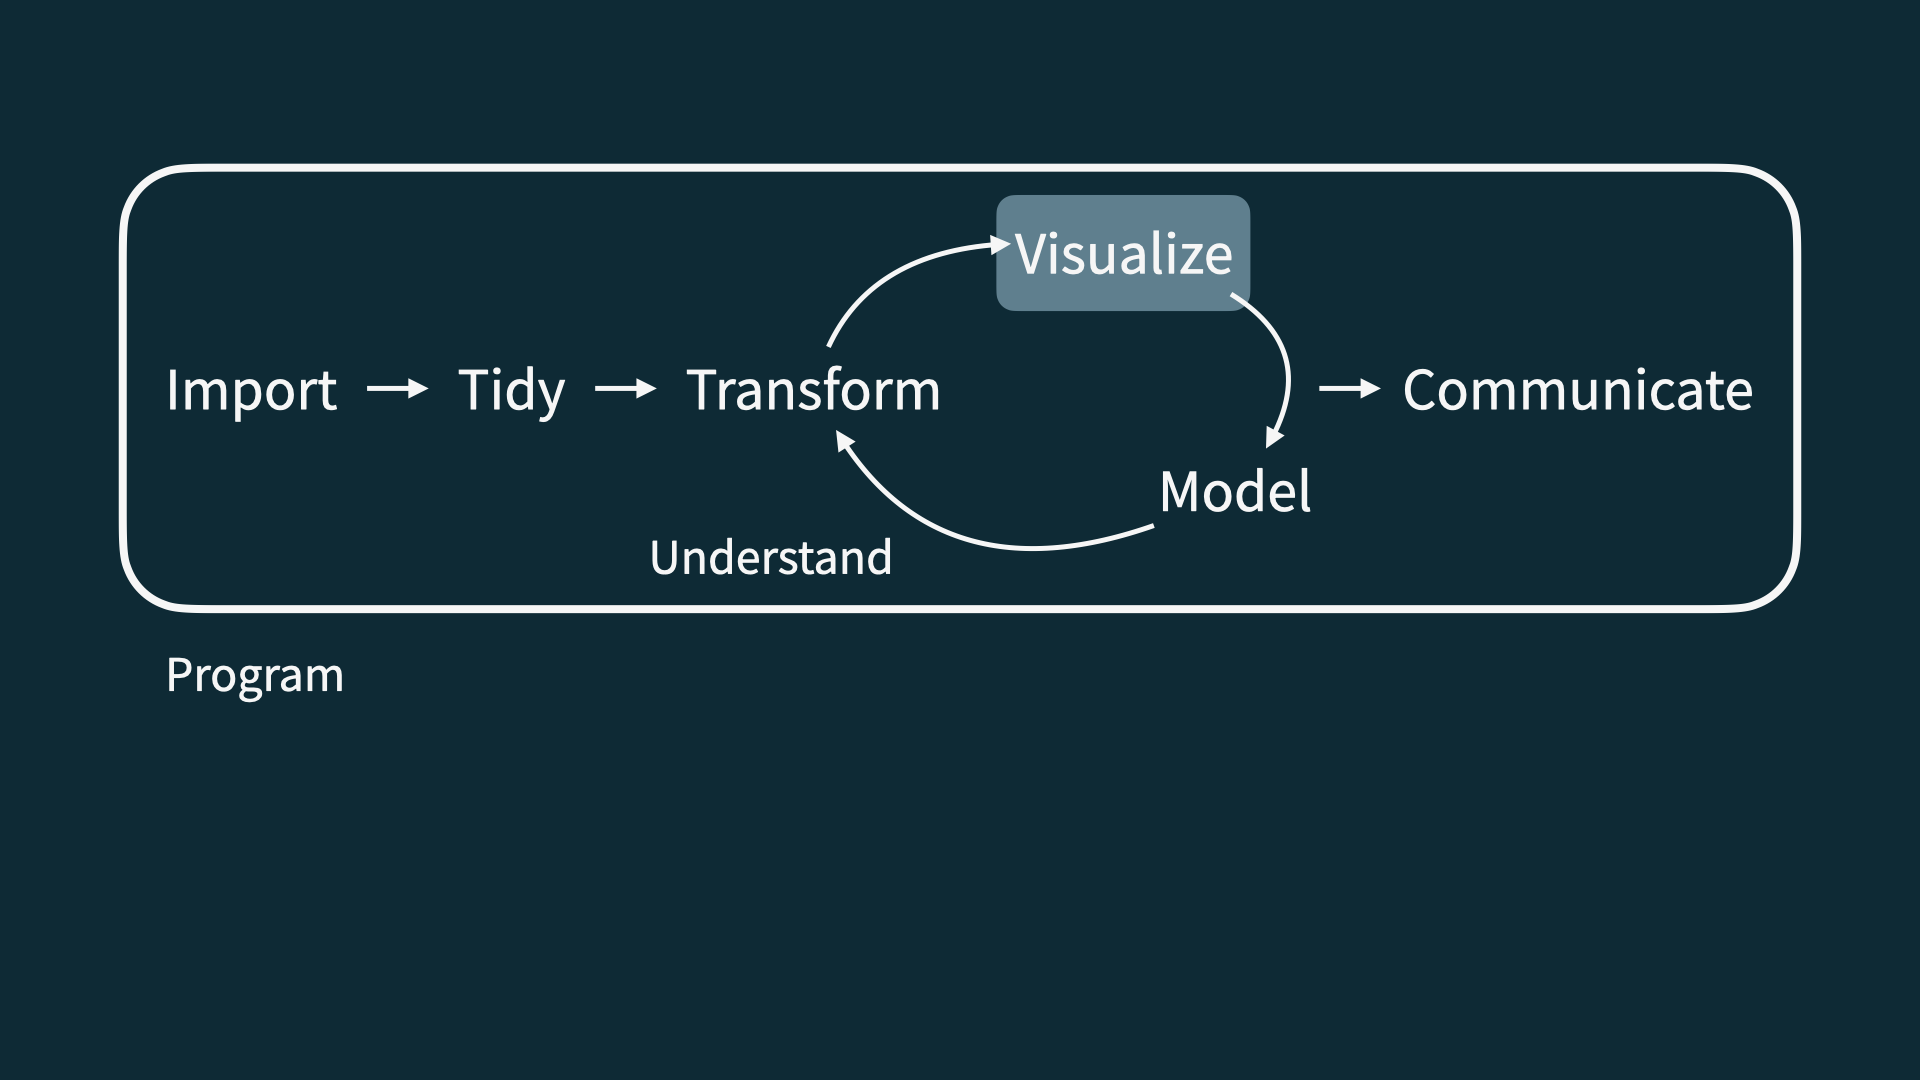
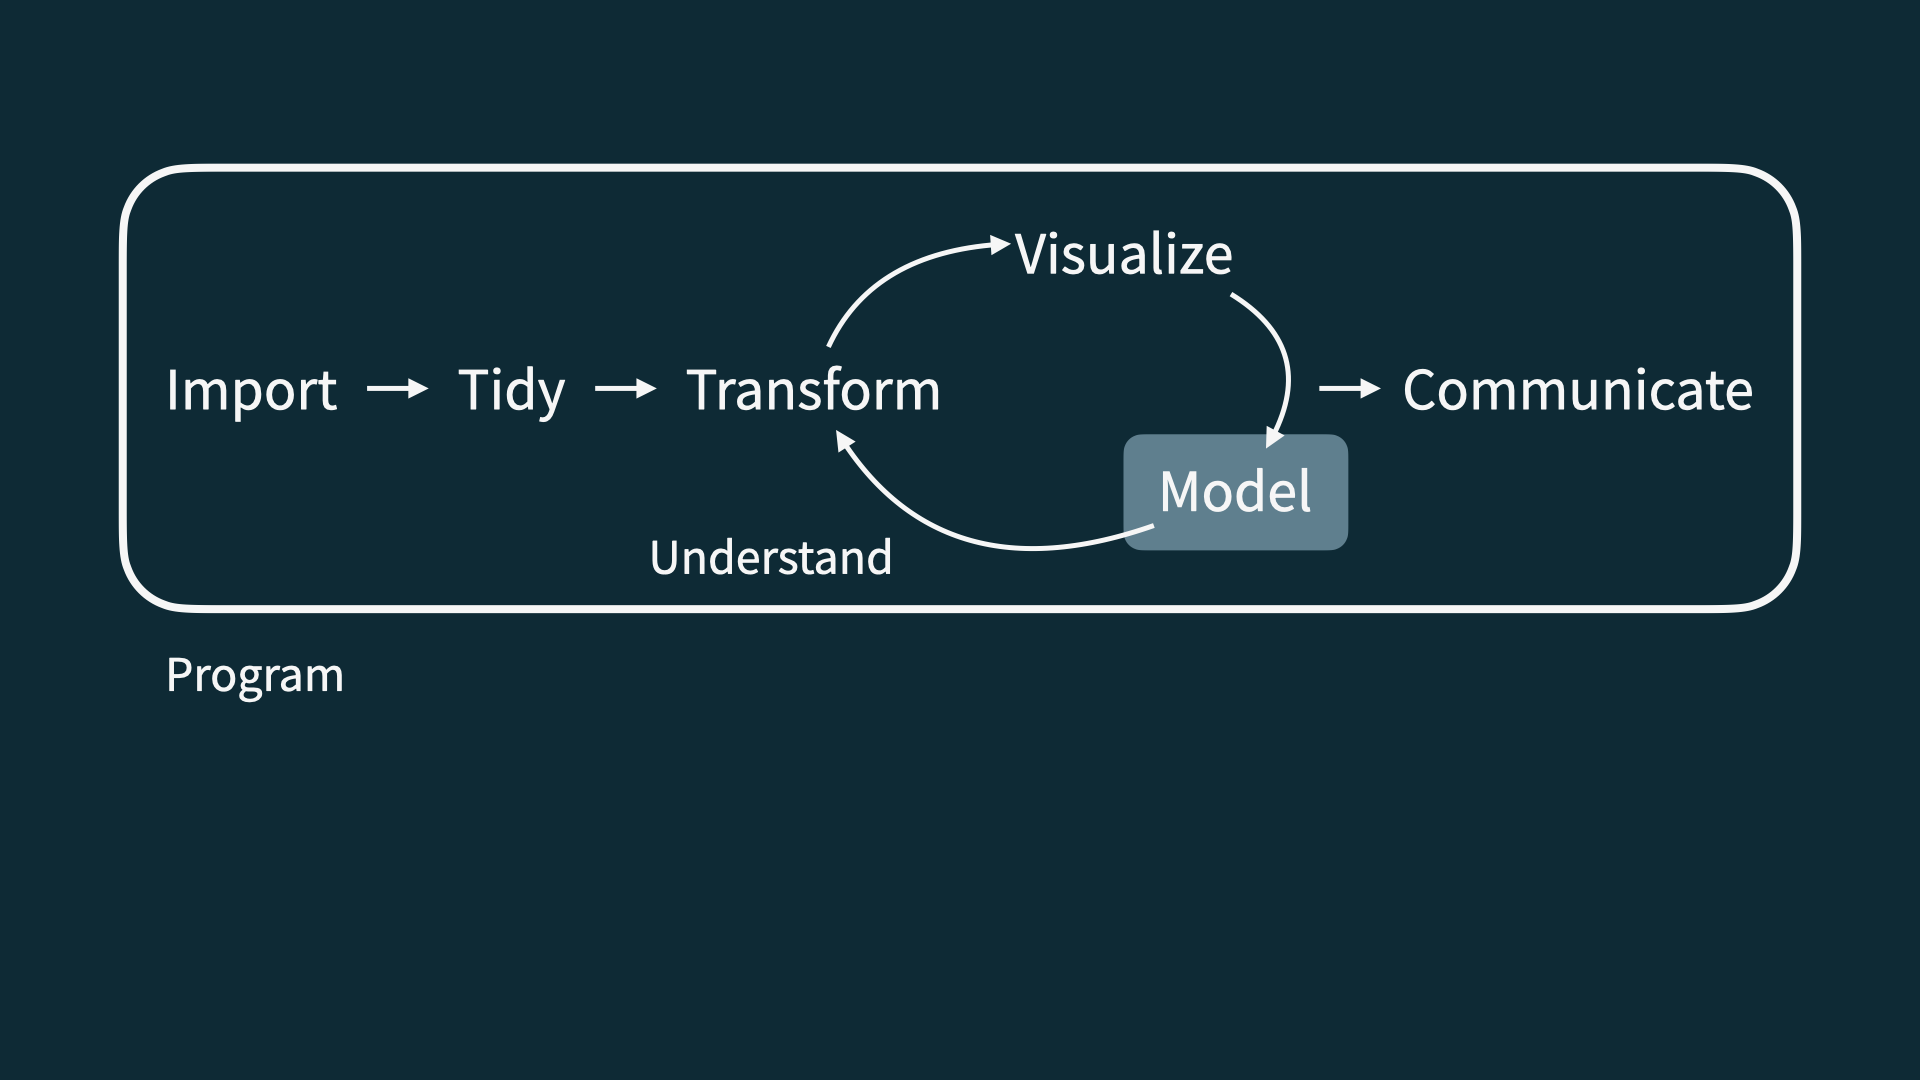
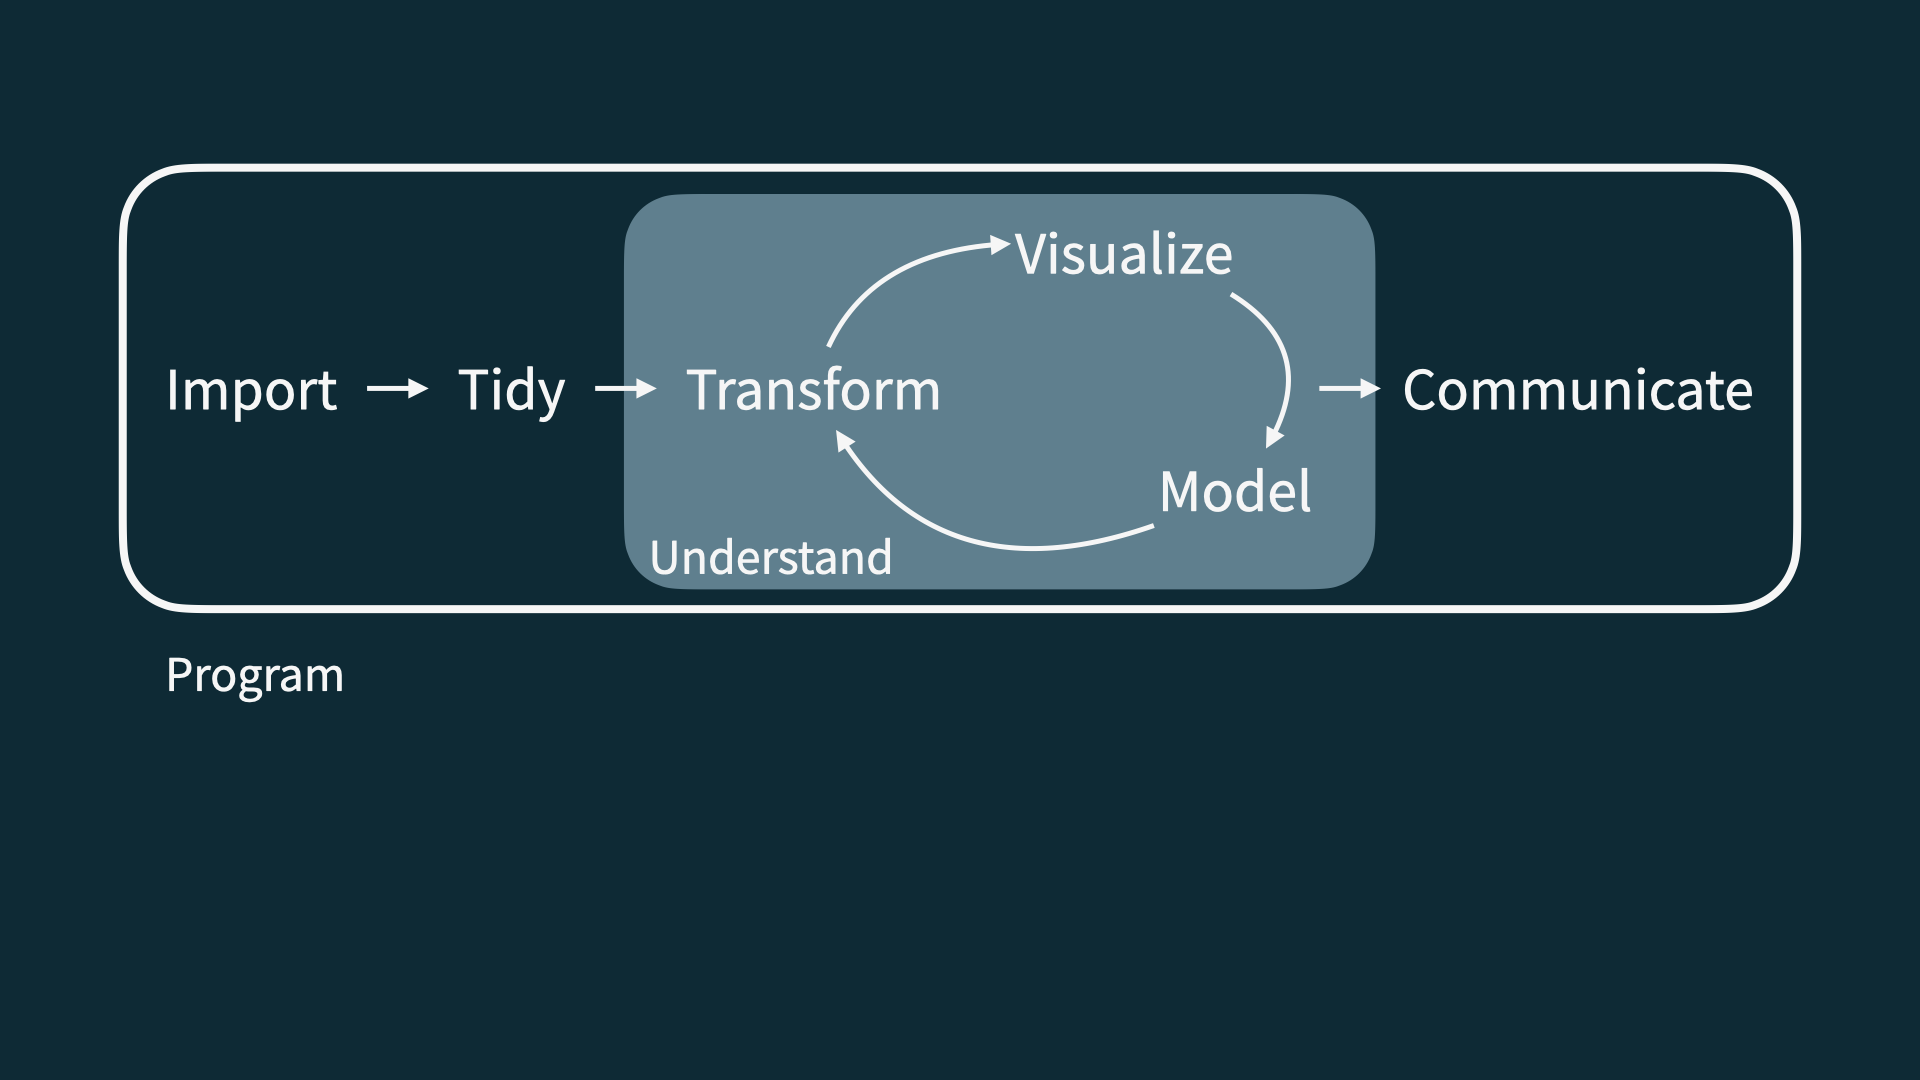
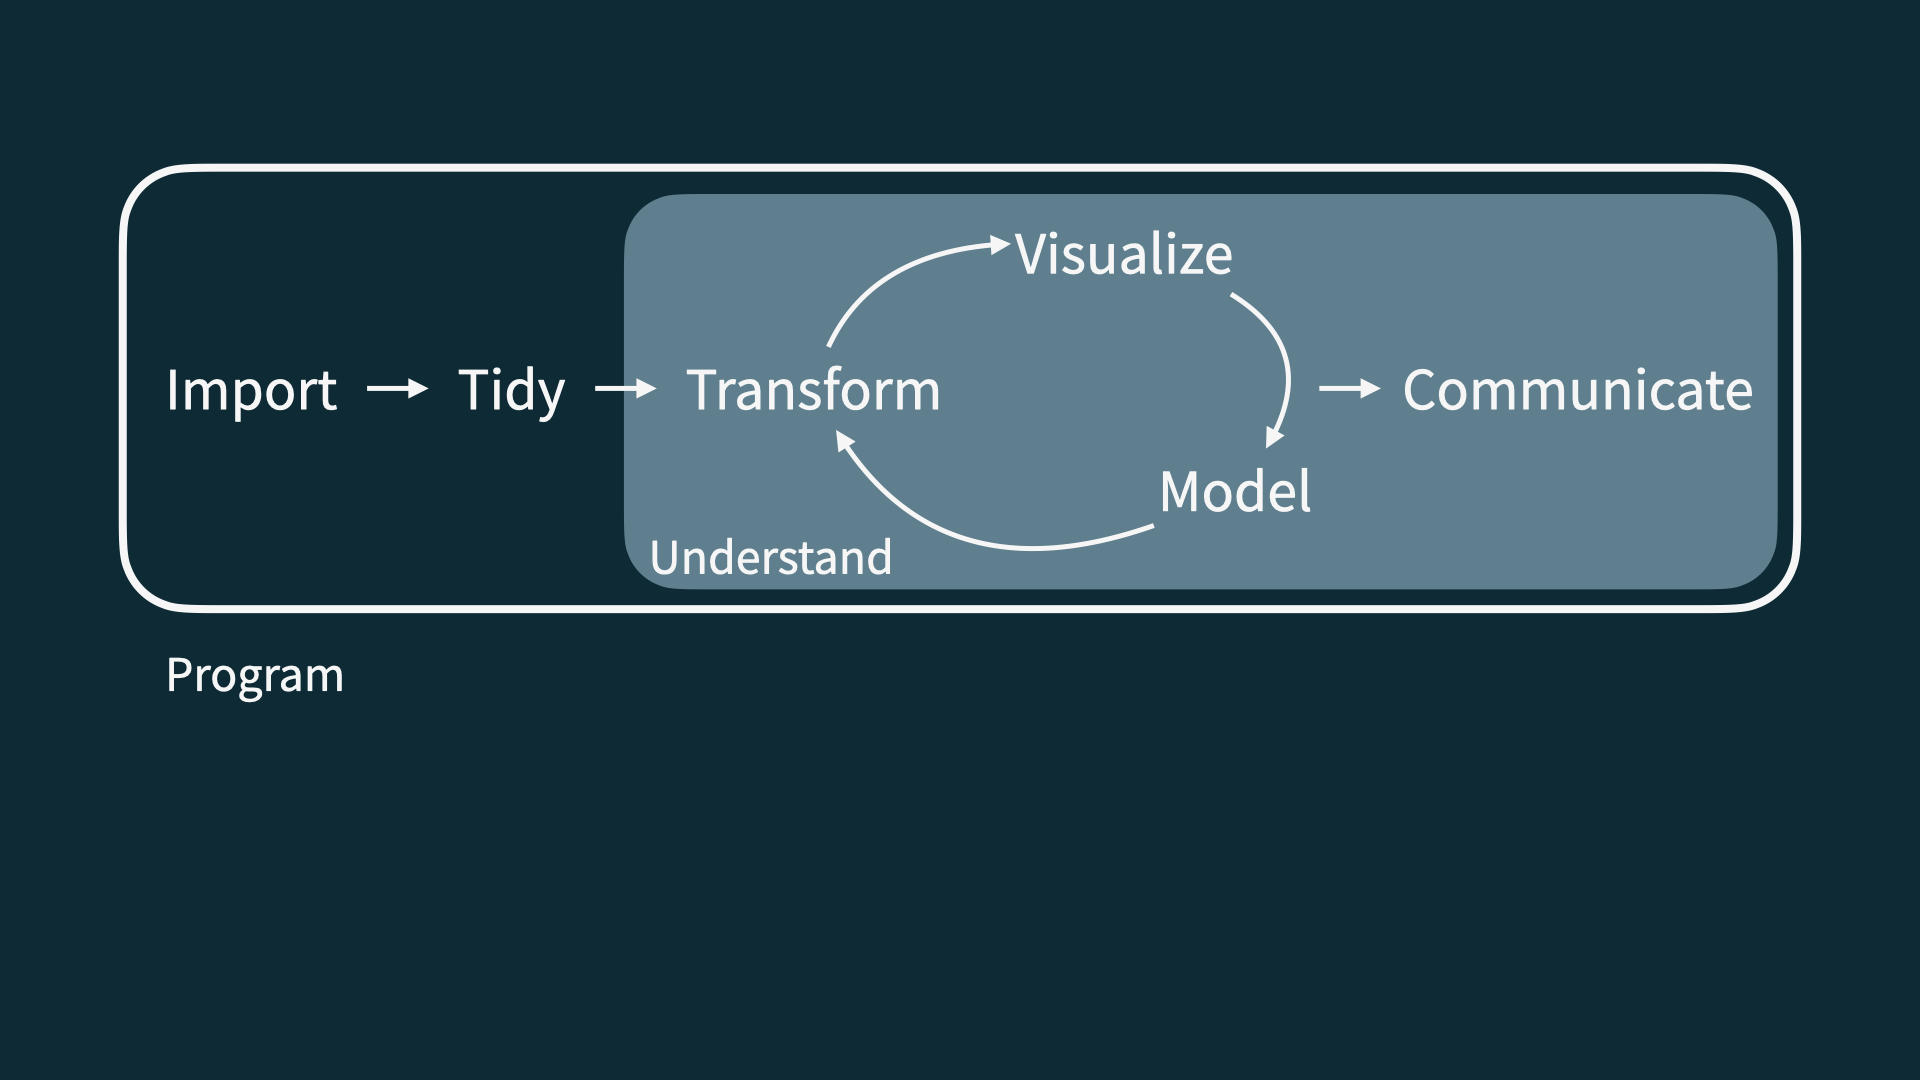
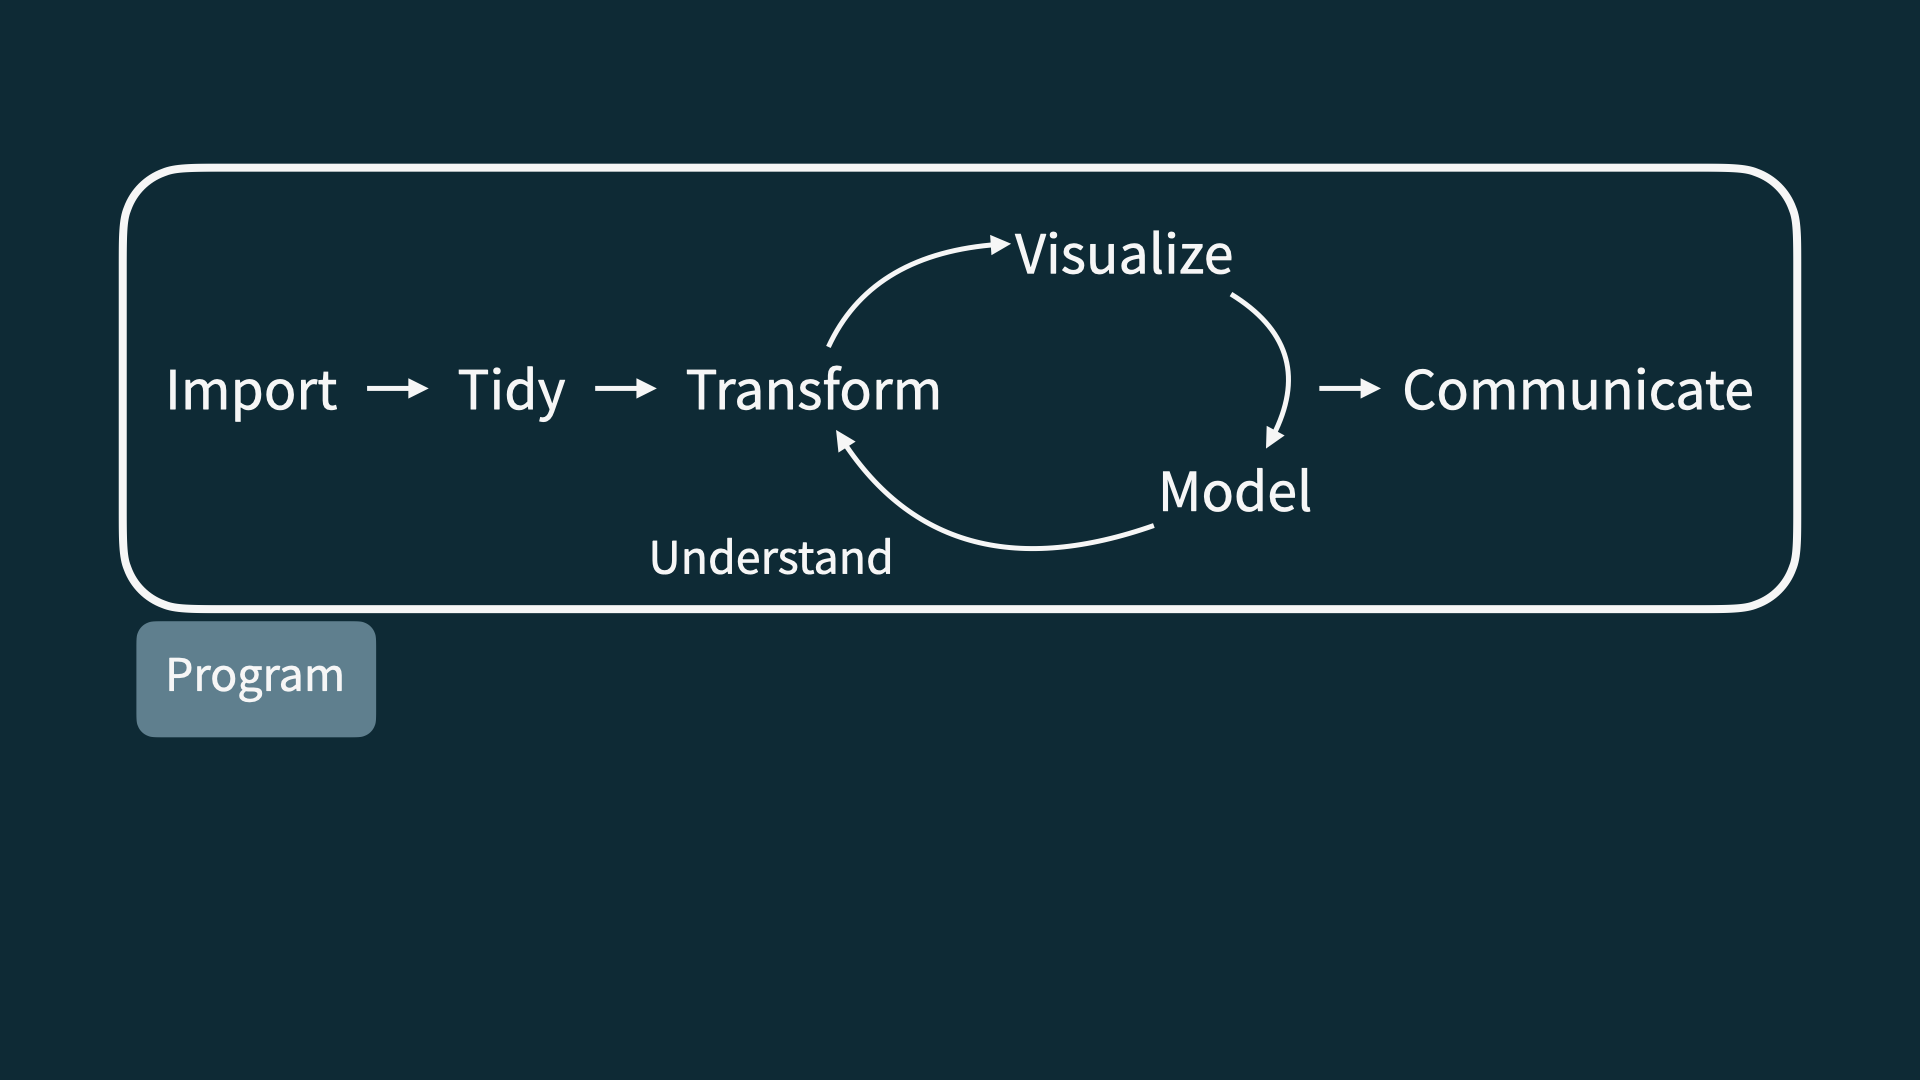
A full scale data science workflow
A full scale data science workflow
Ask an interesting question / what questions are your community asking?
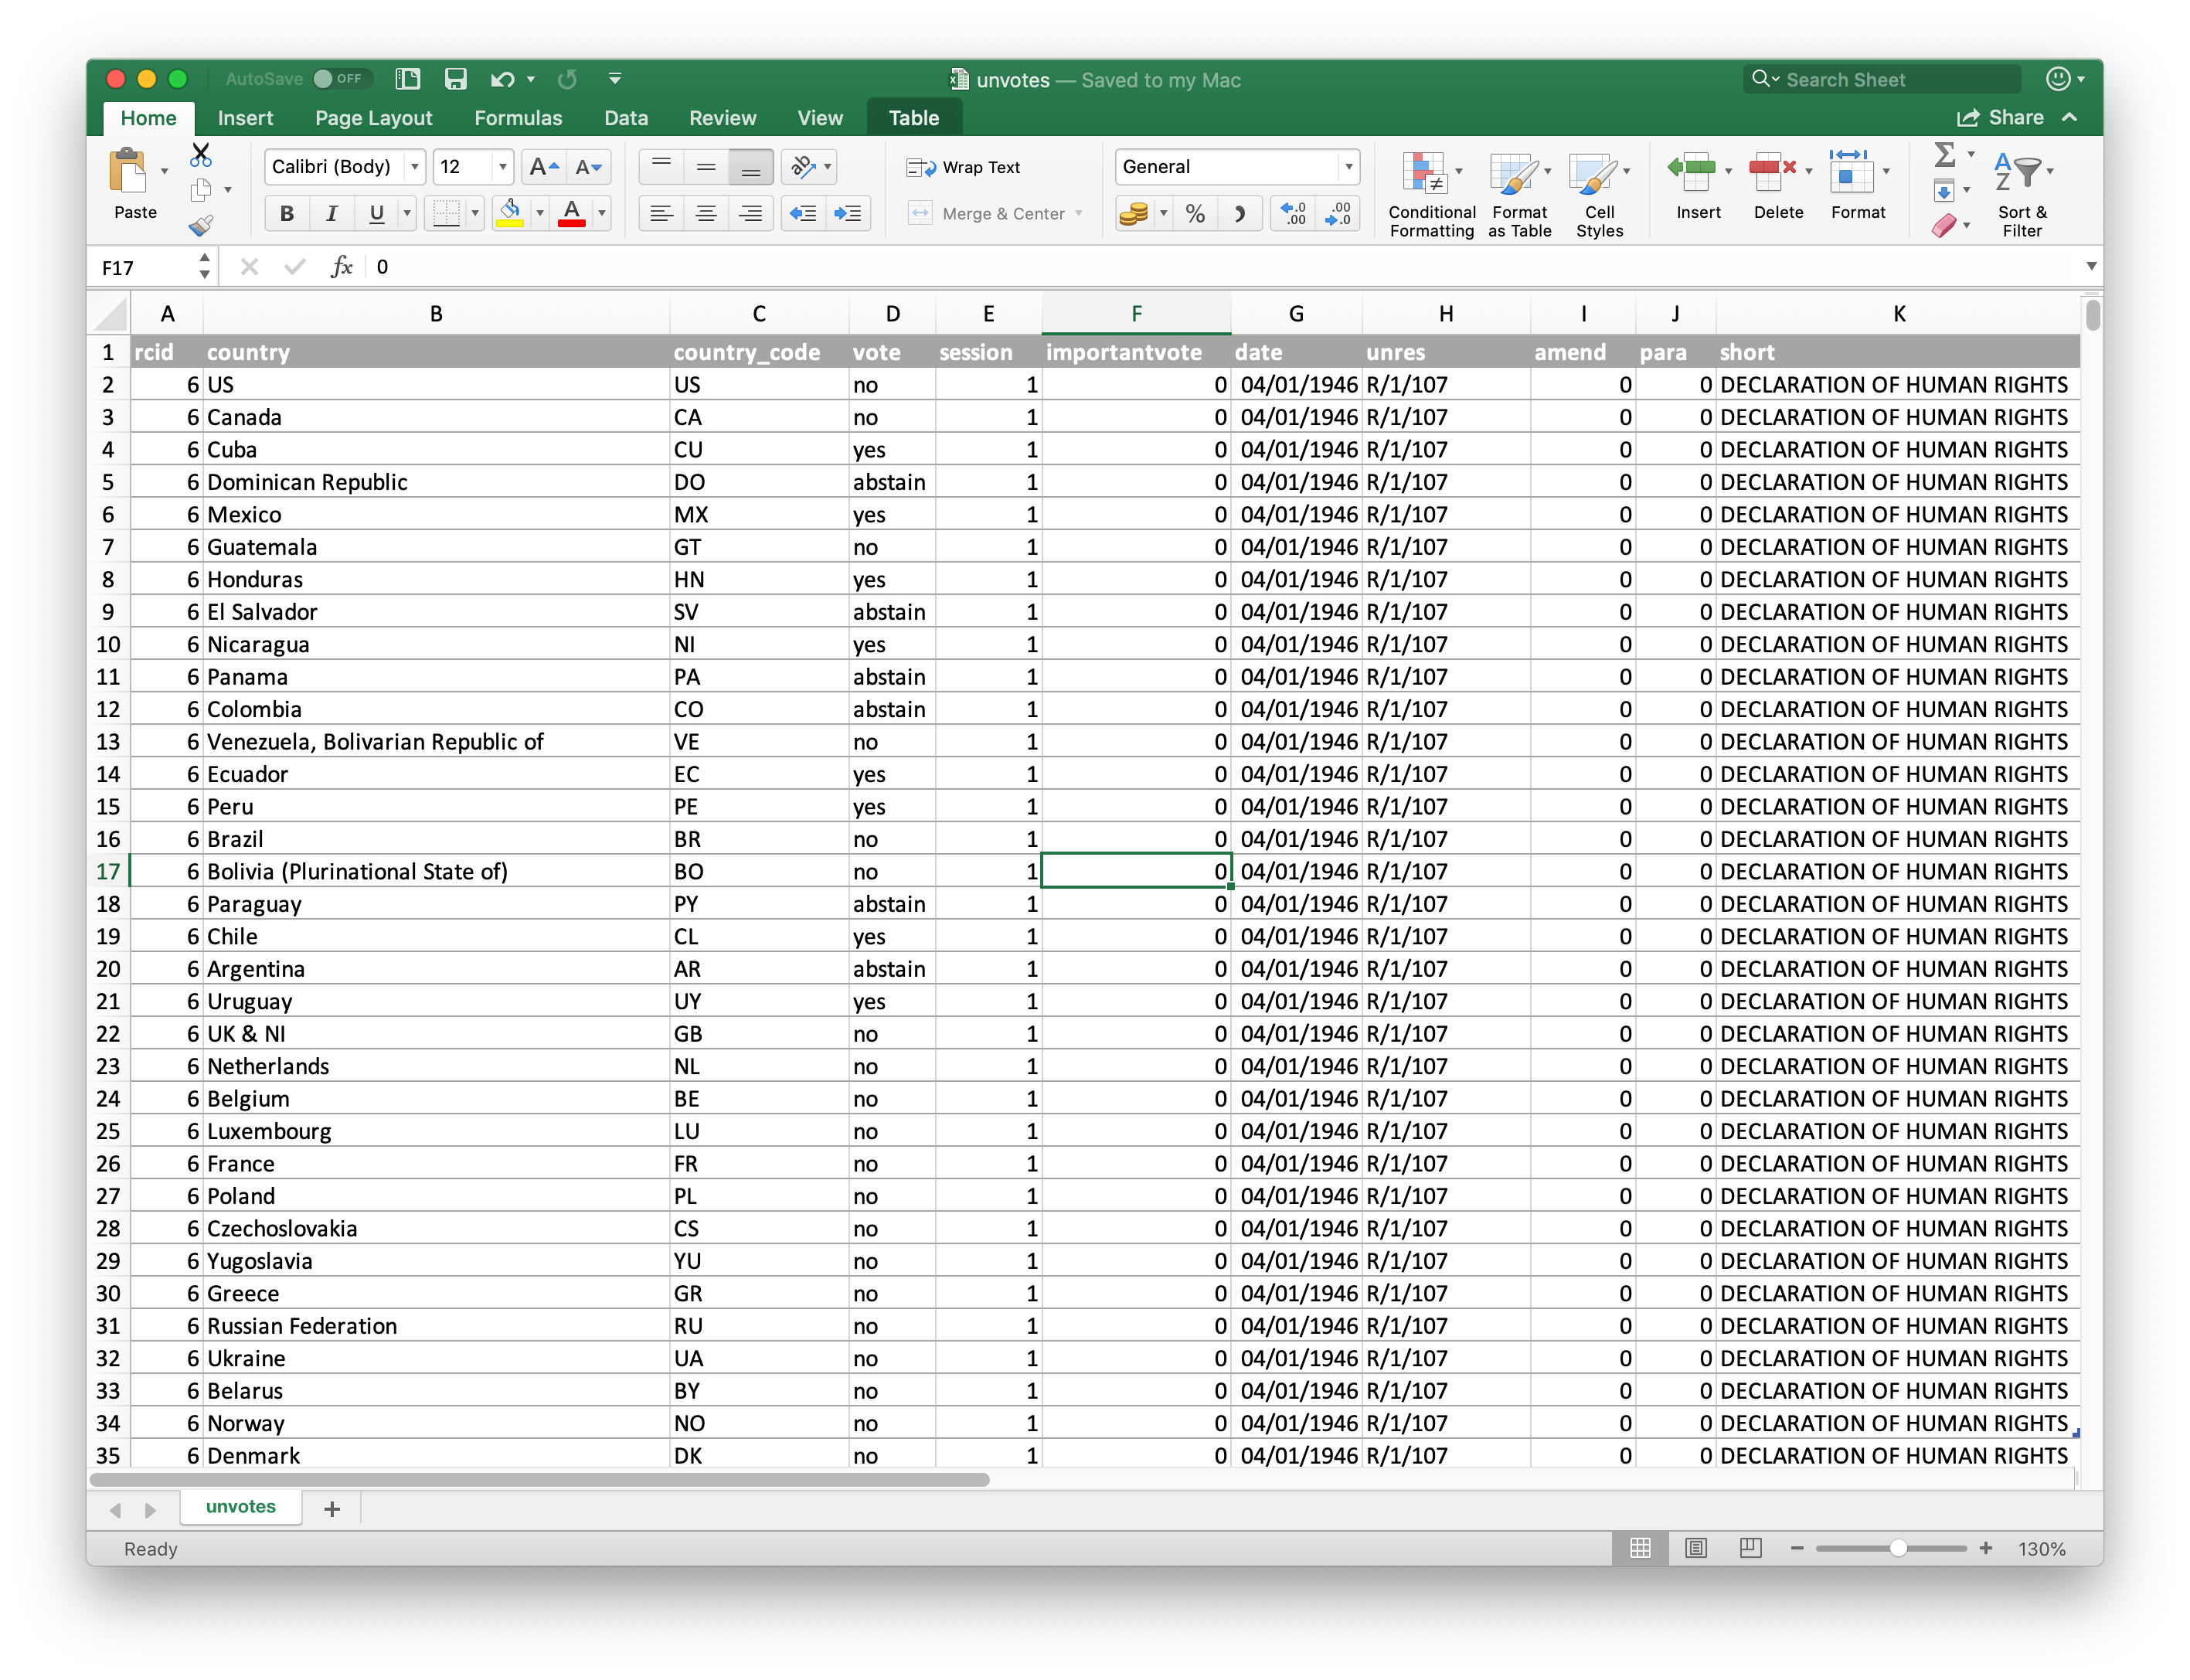
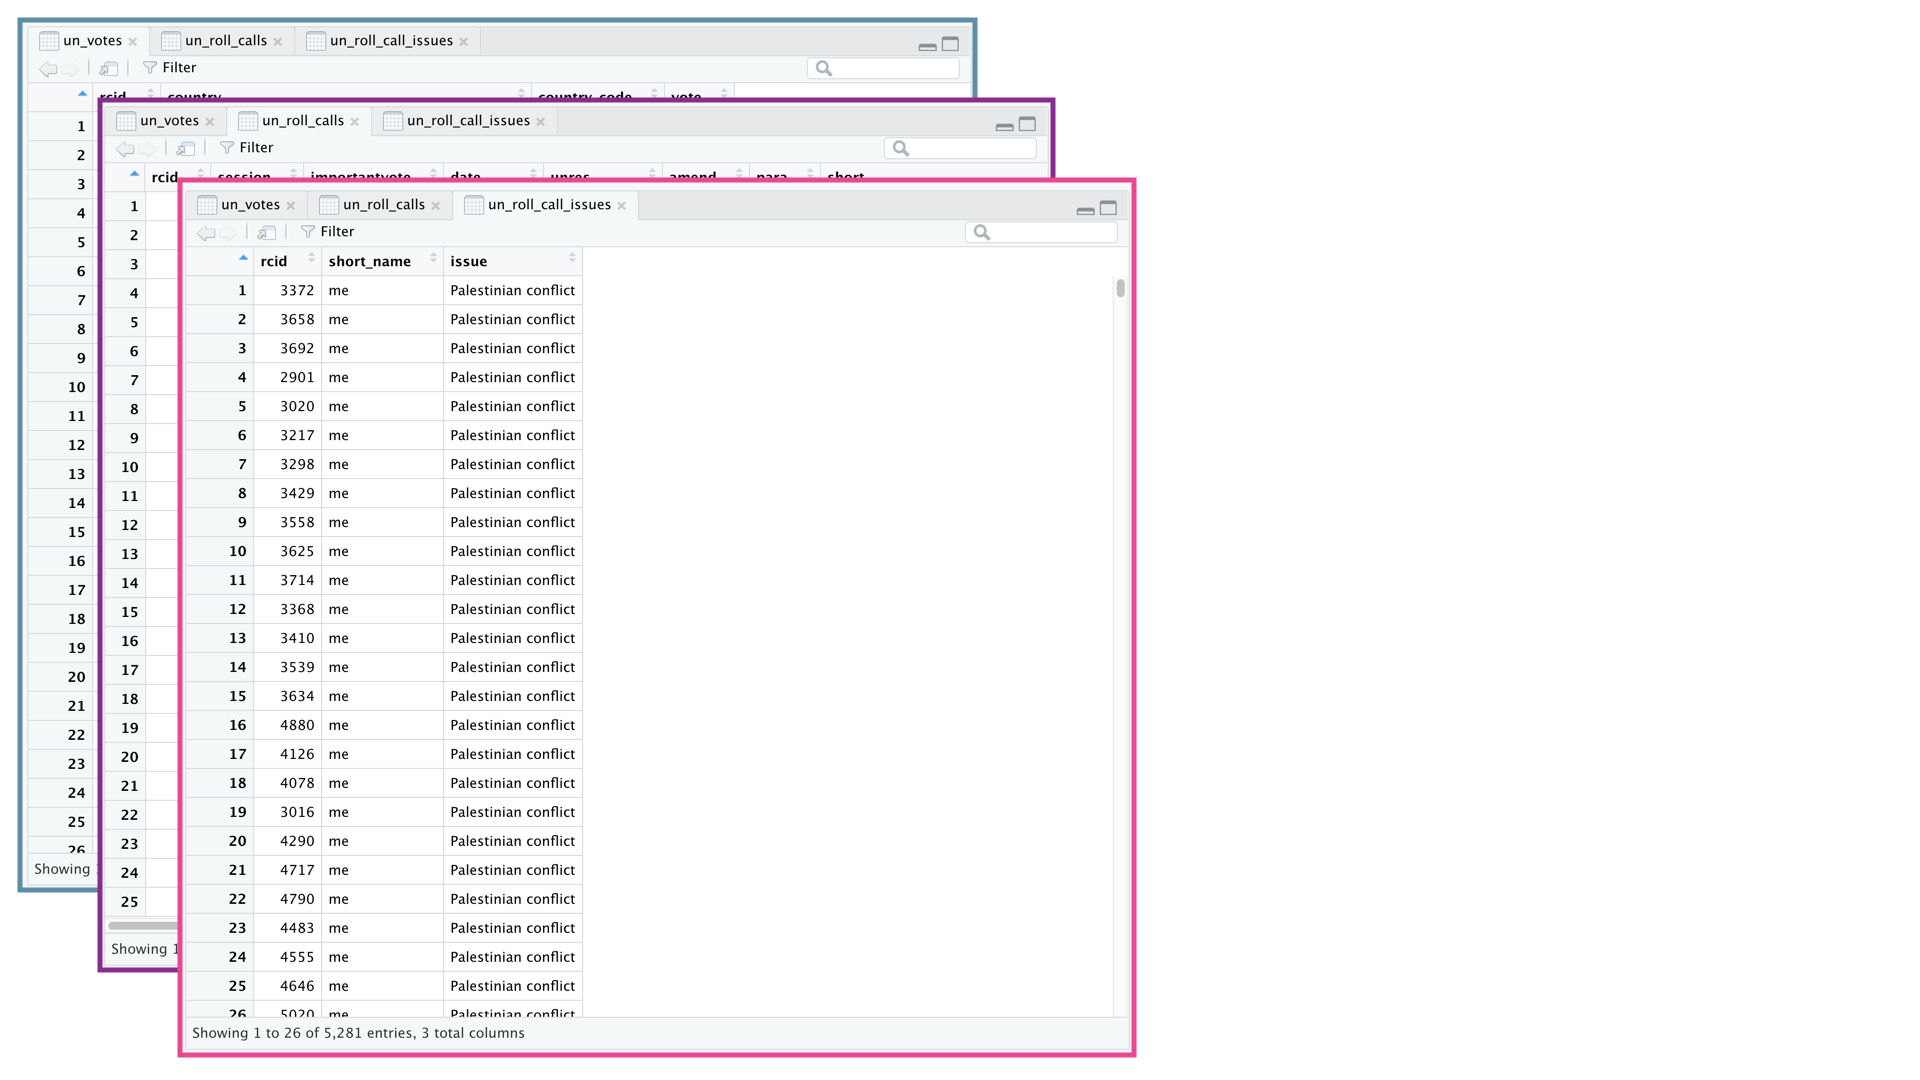
Get the data
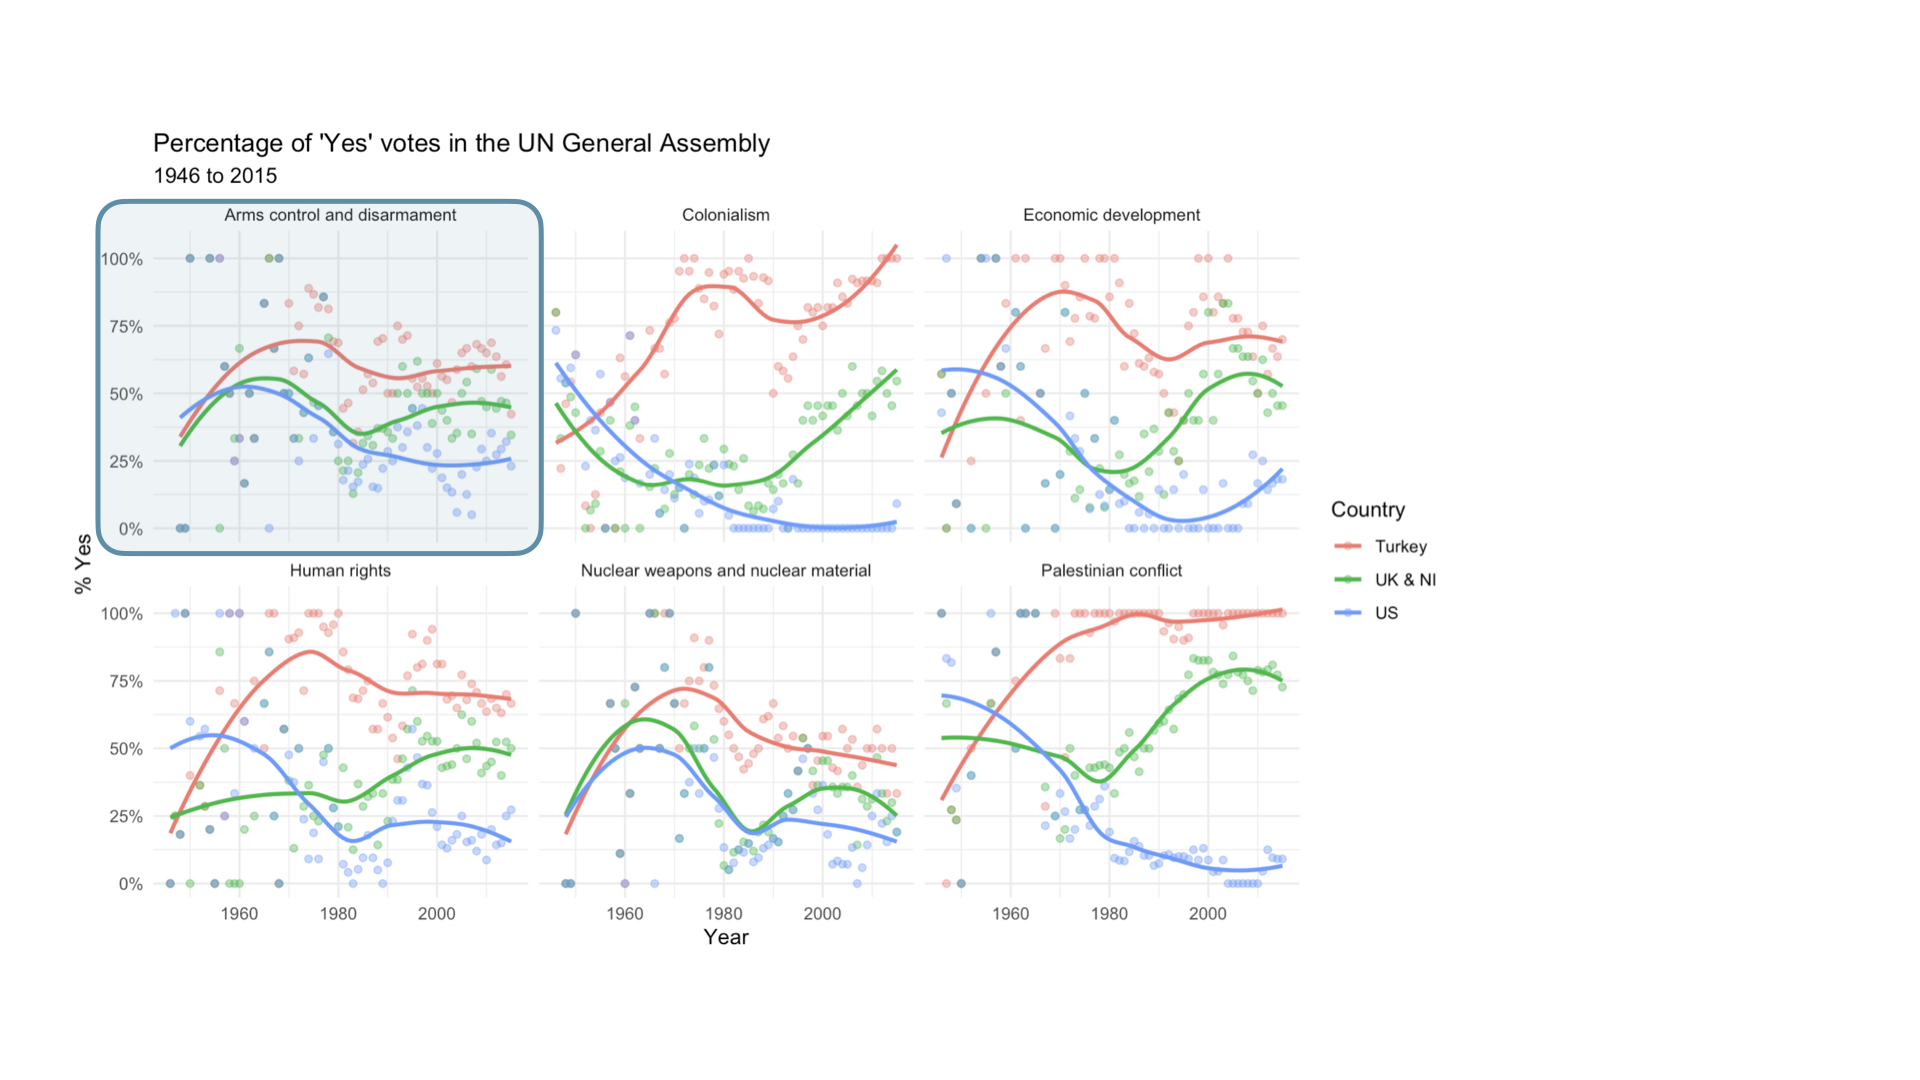
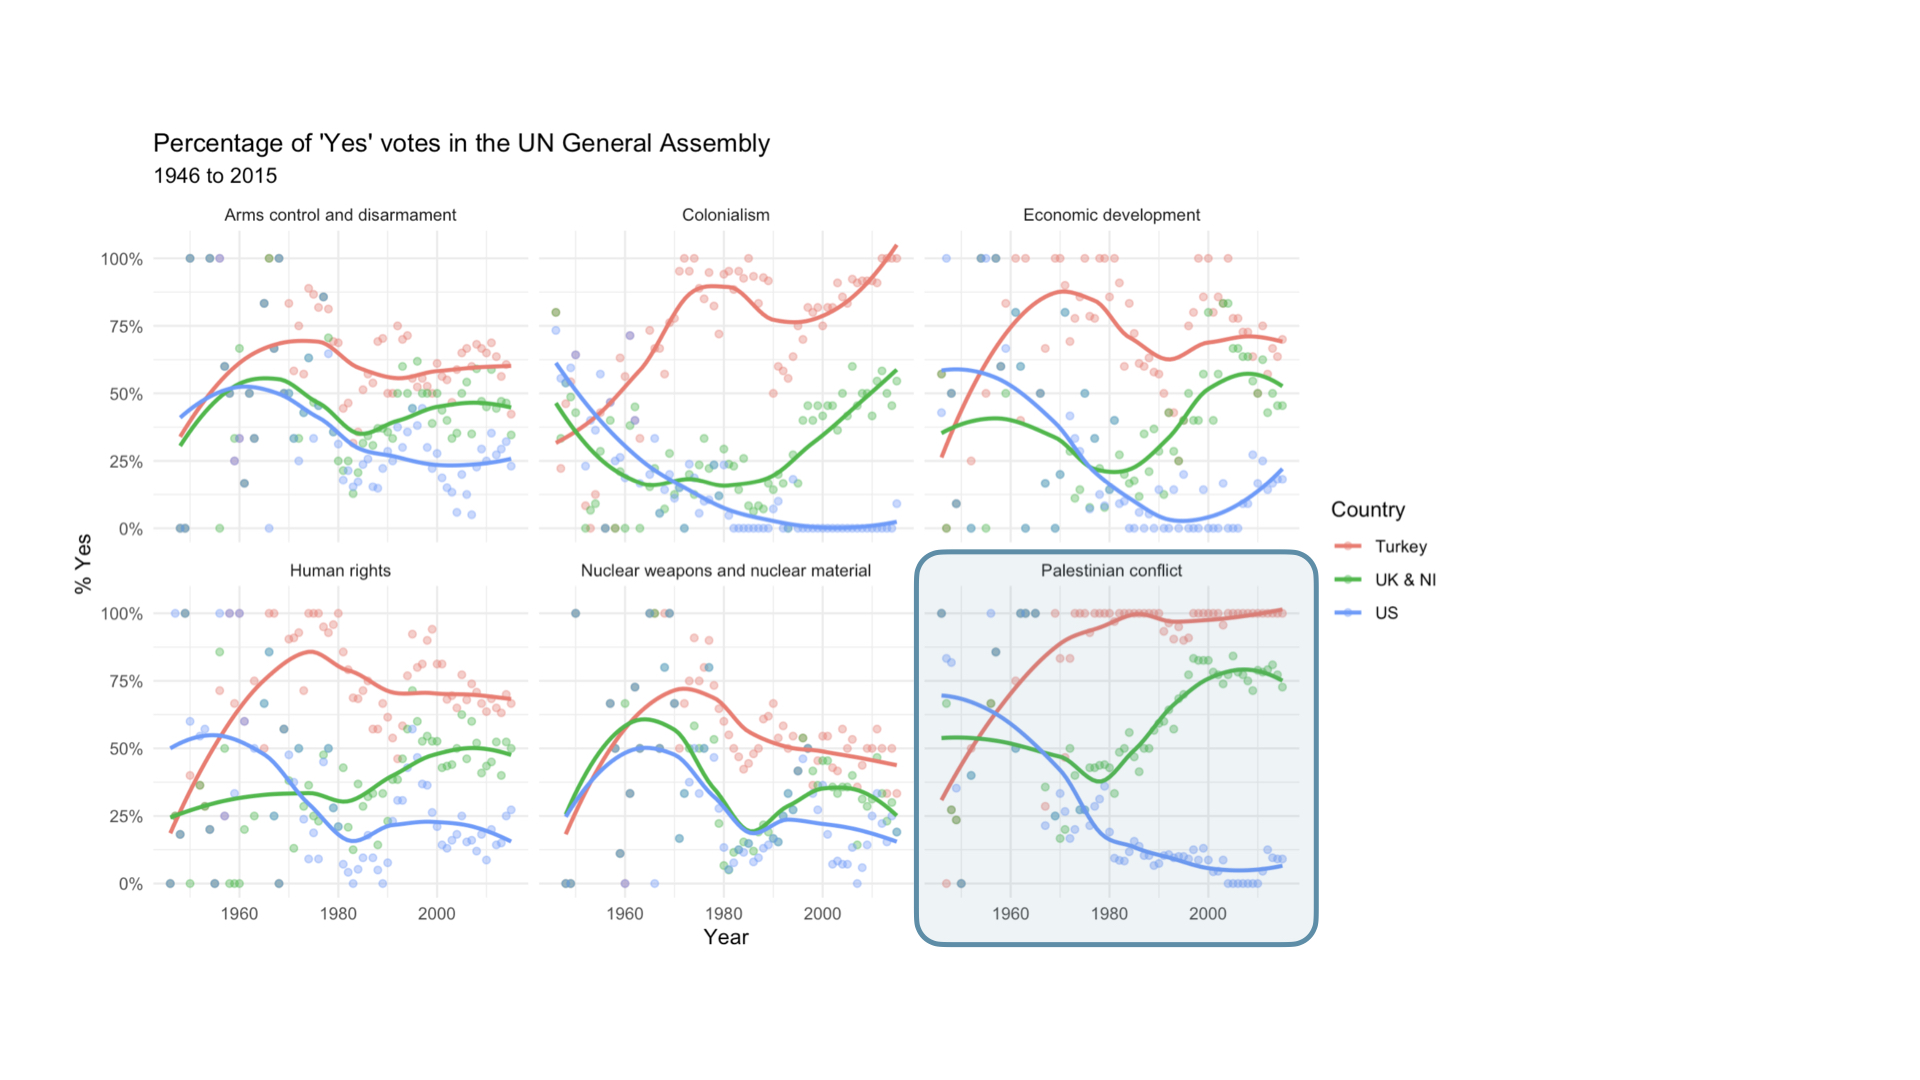
Explore the data
Model the data
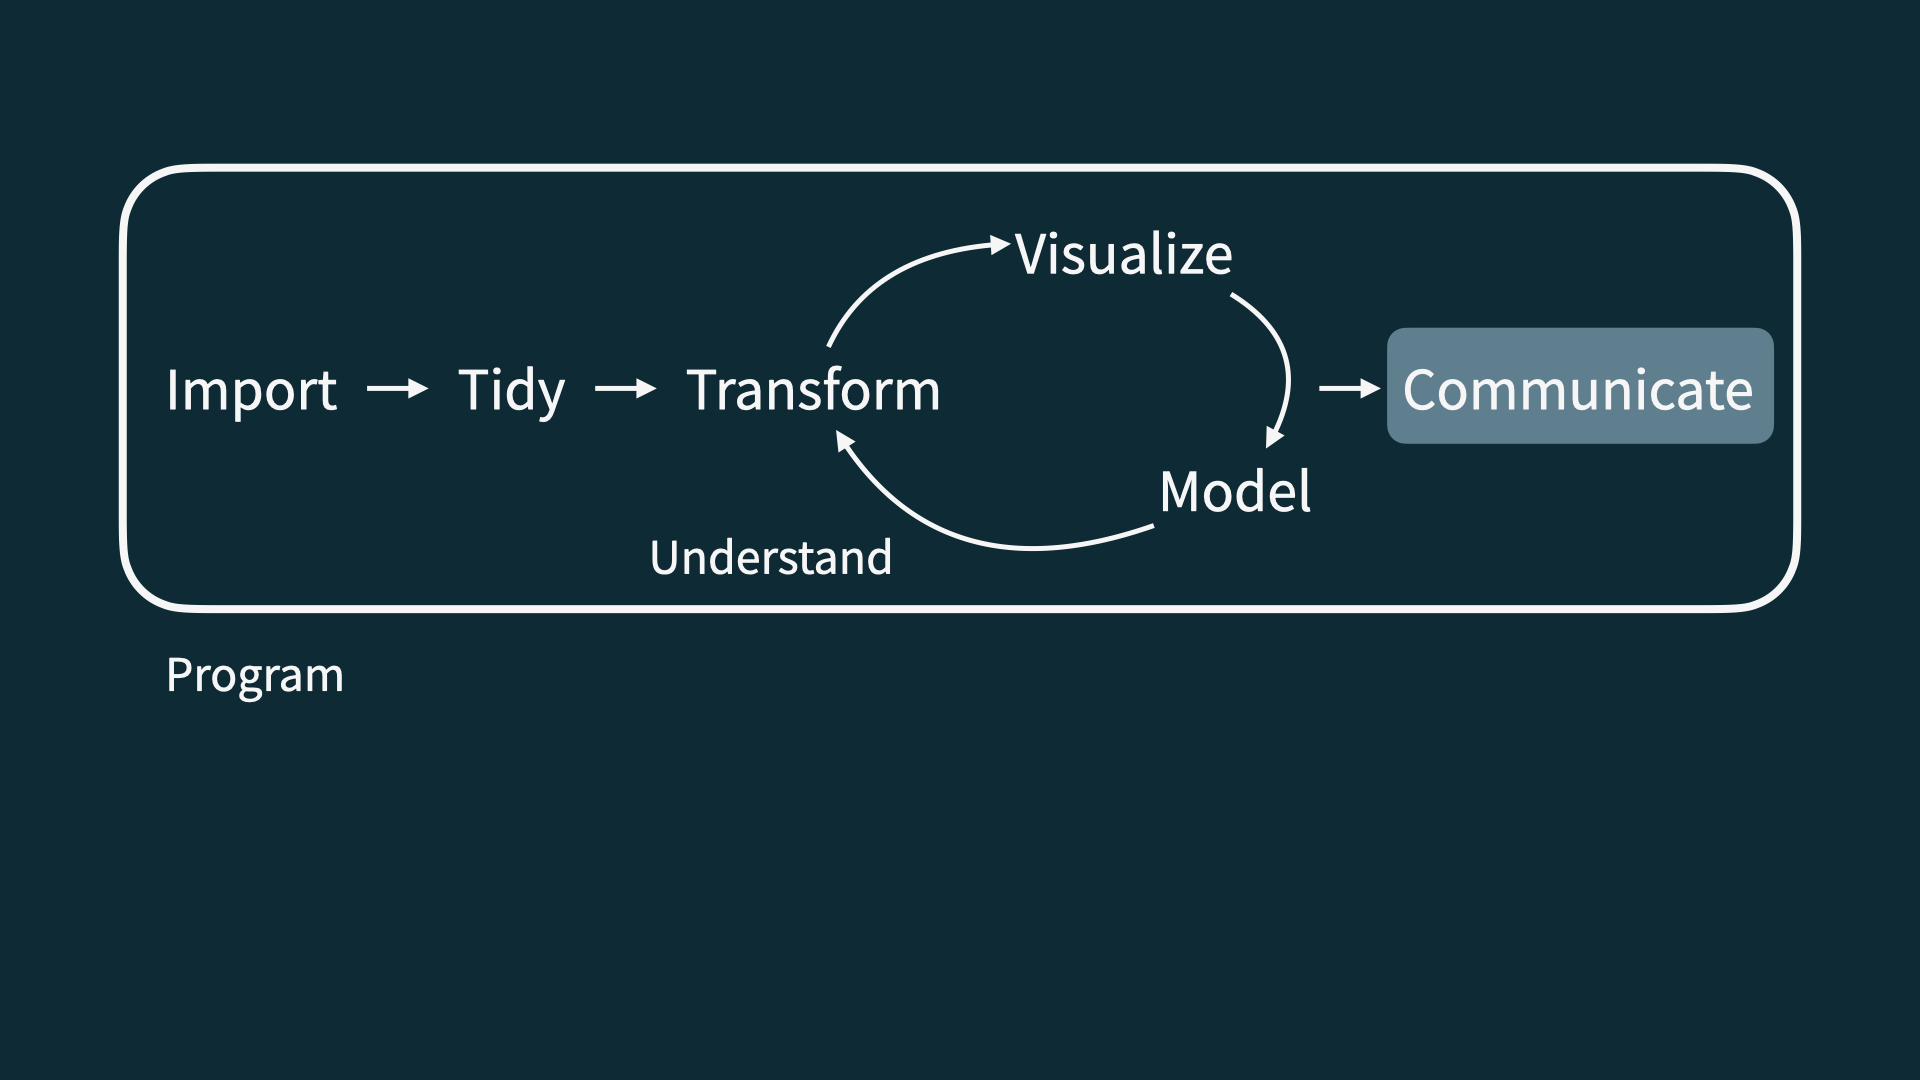
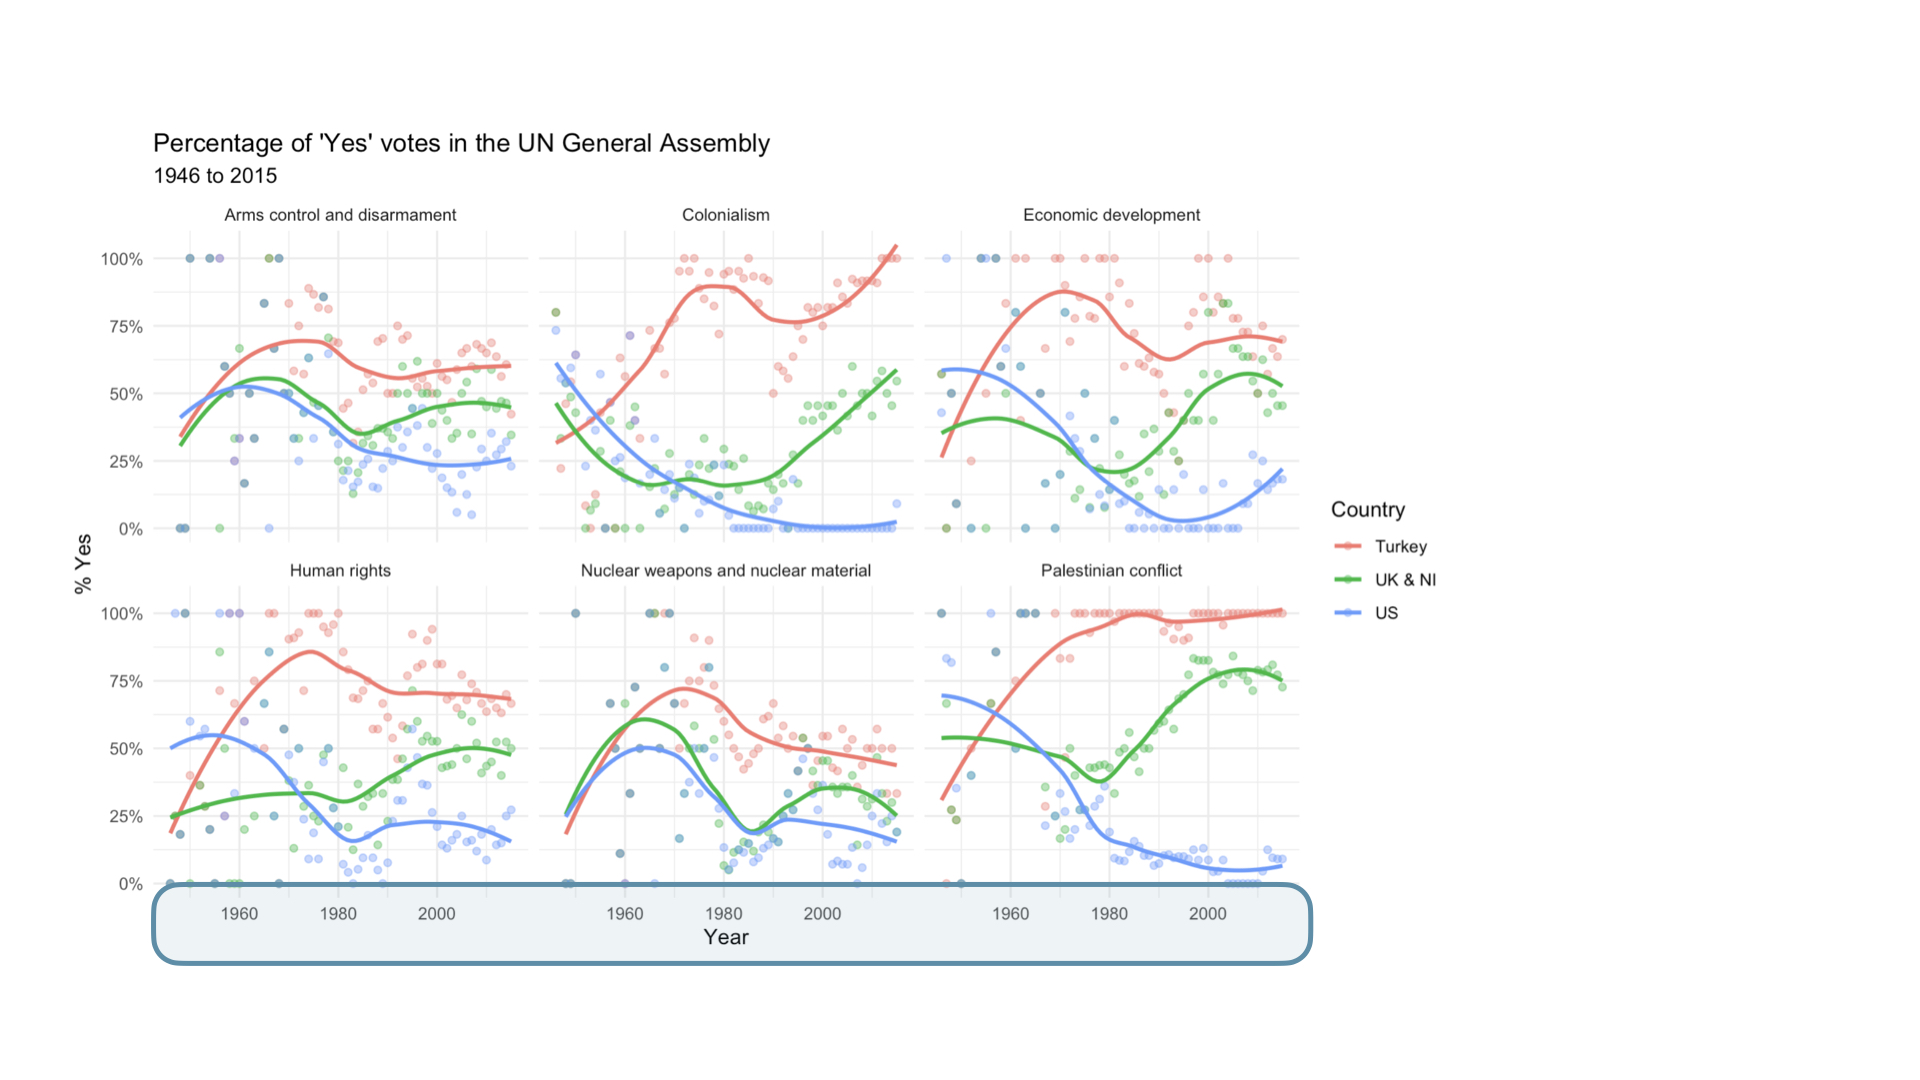
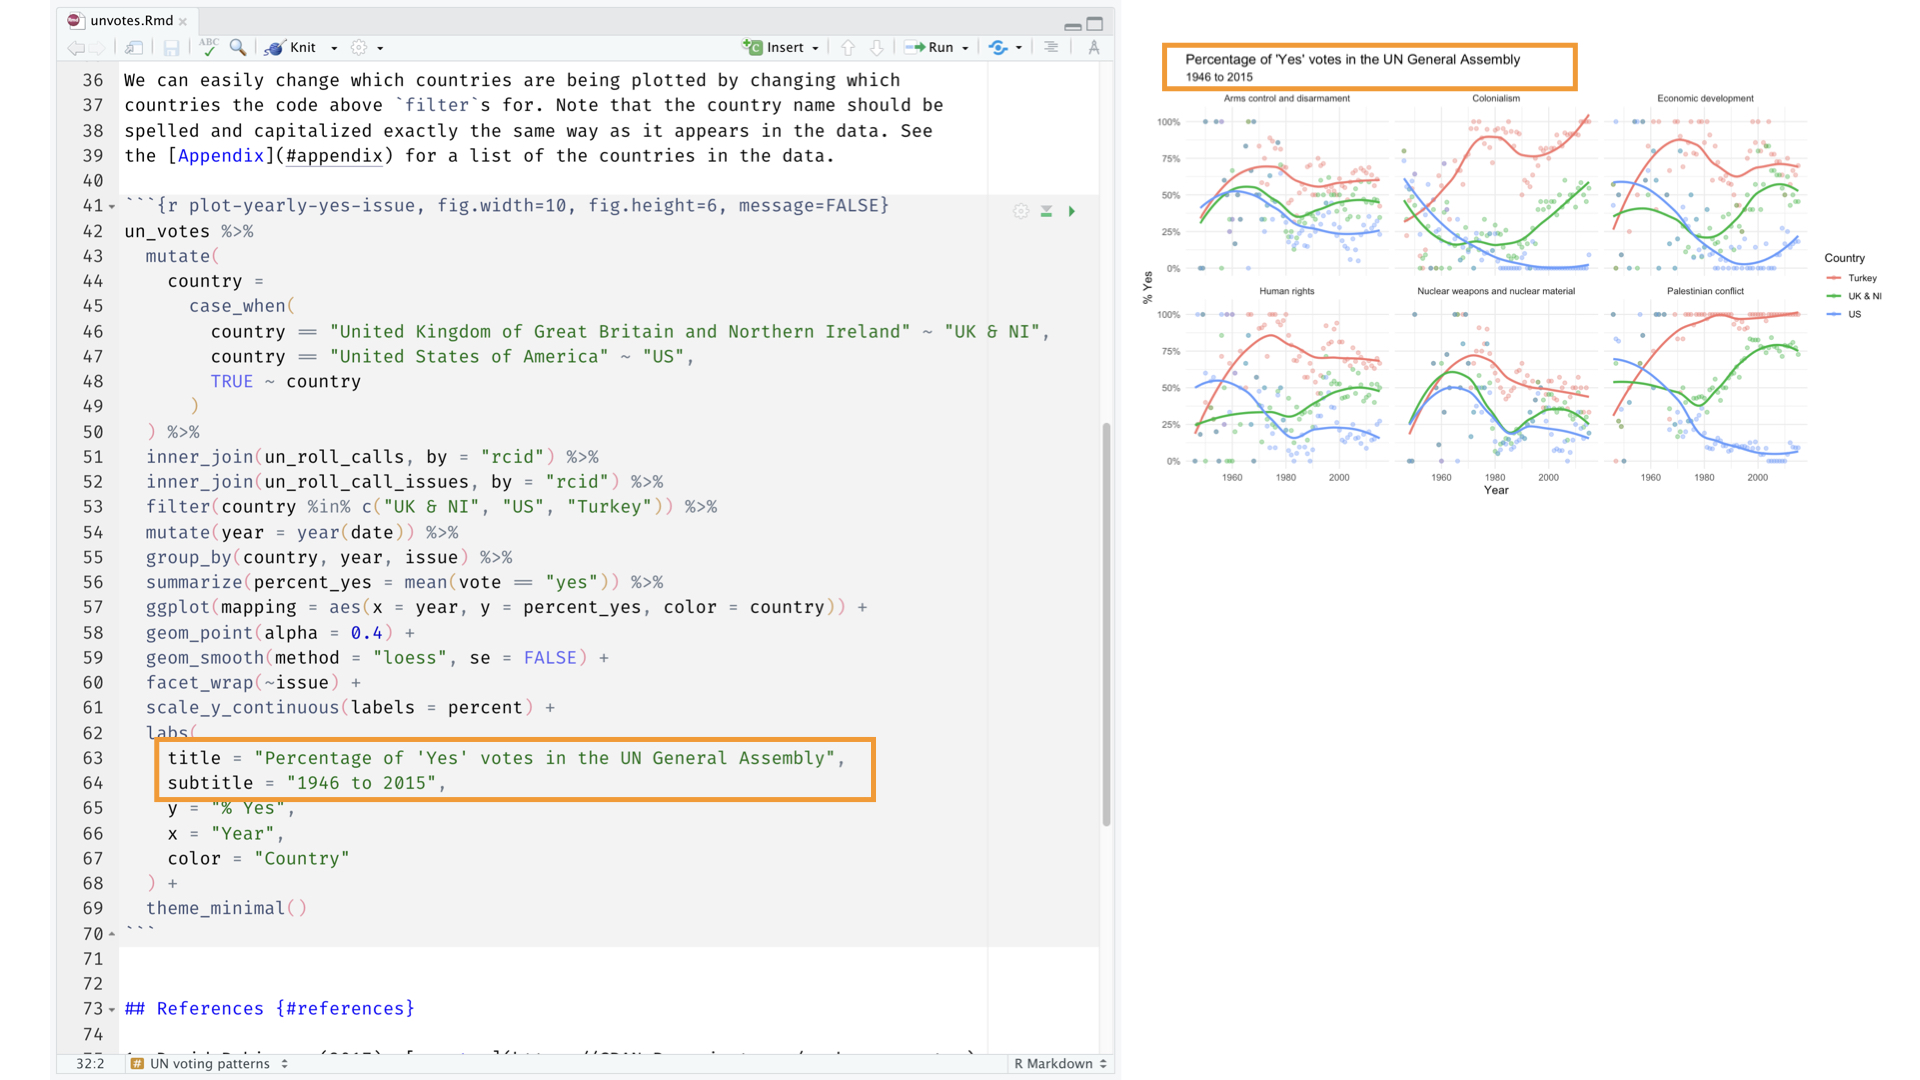
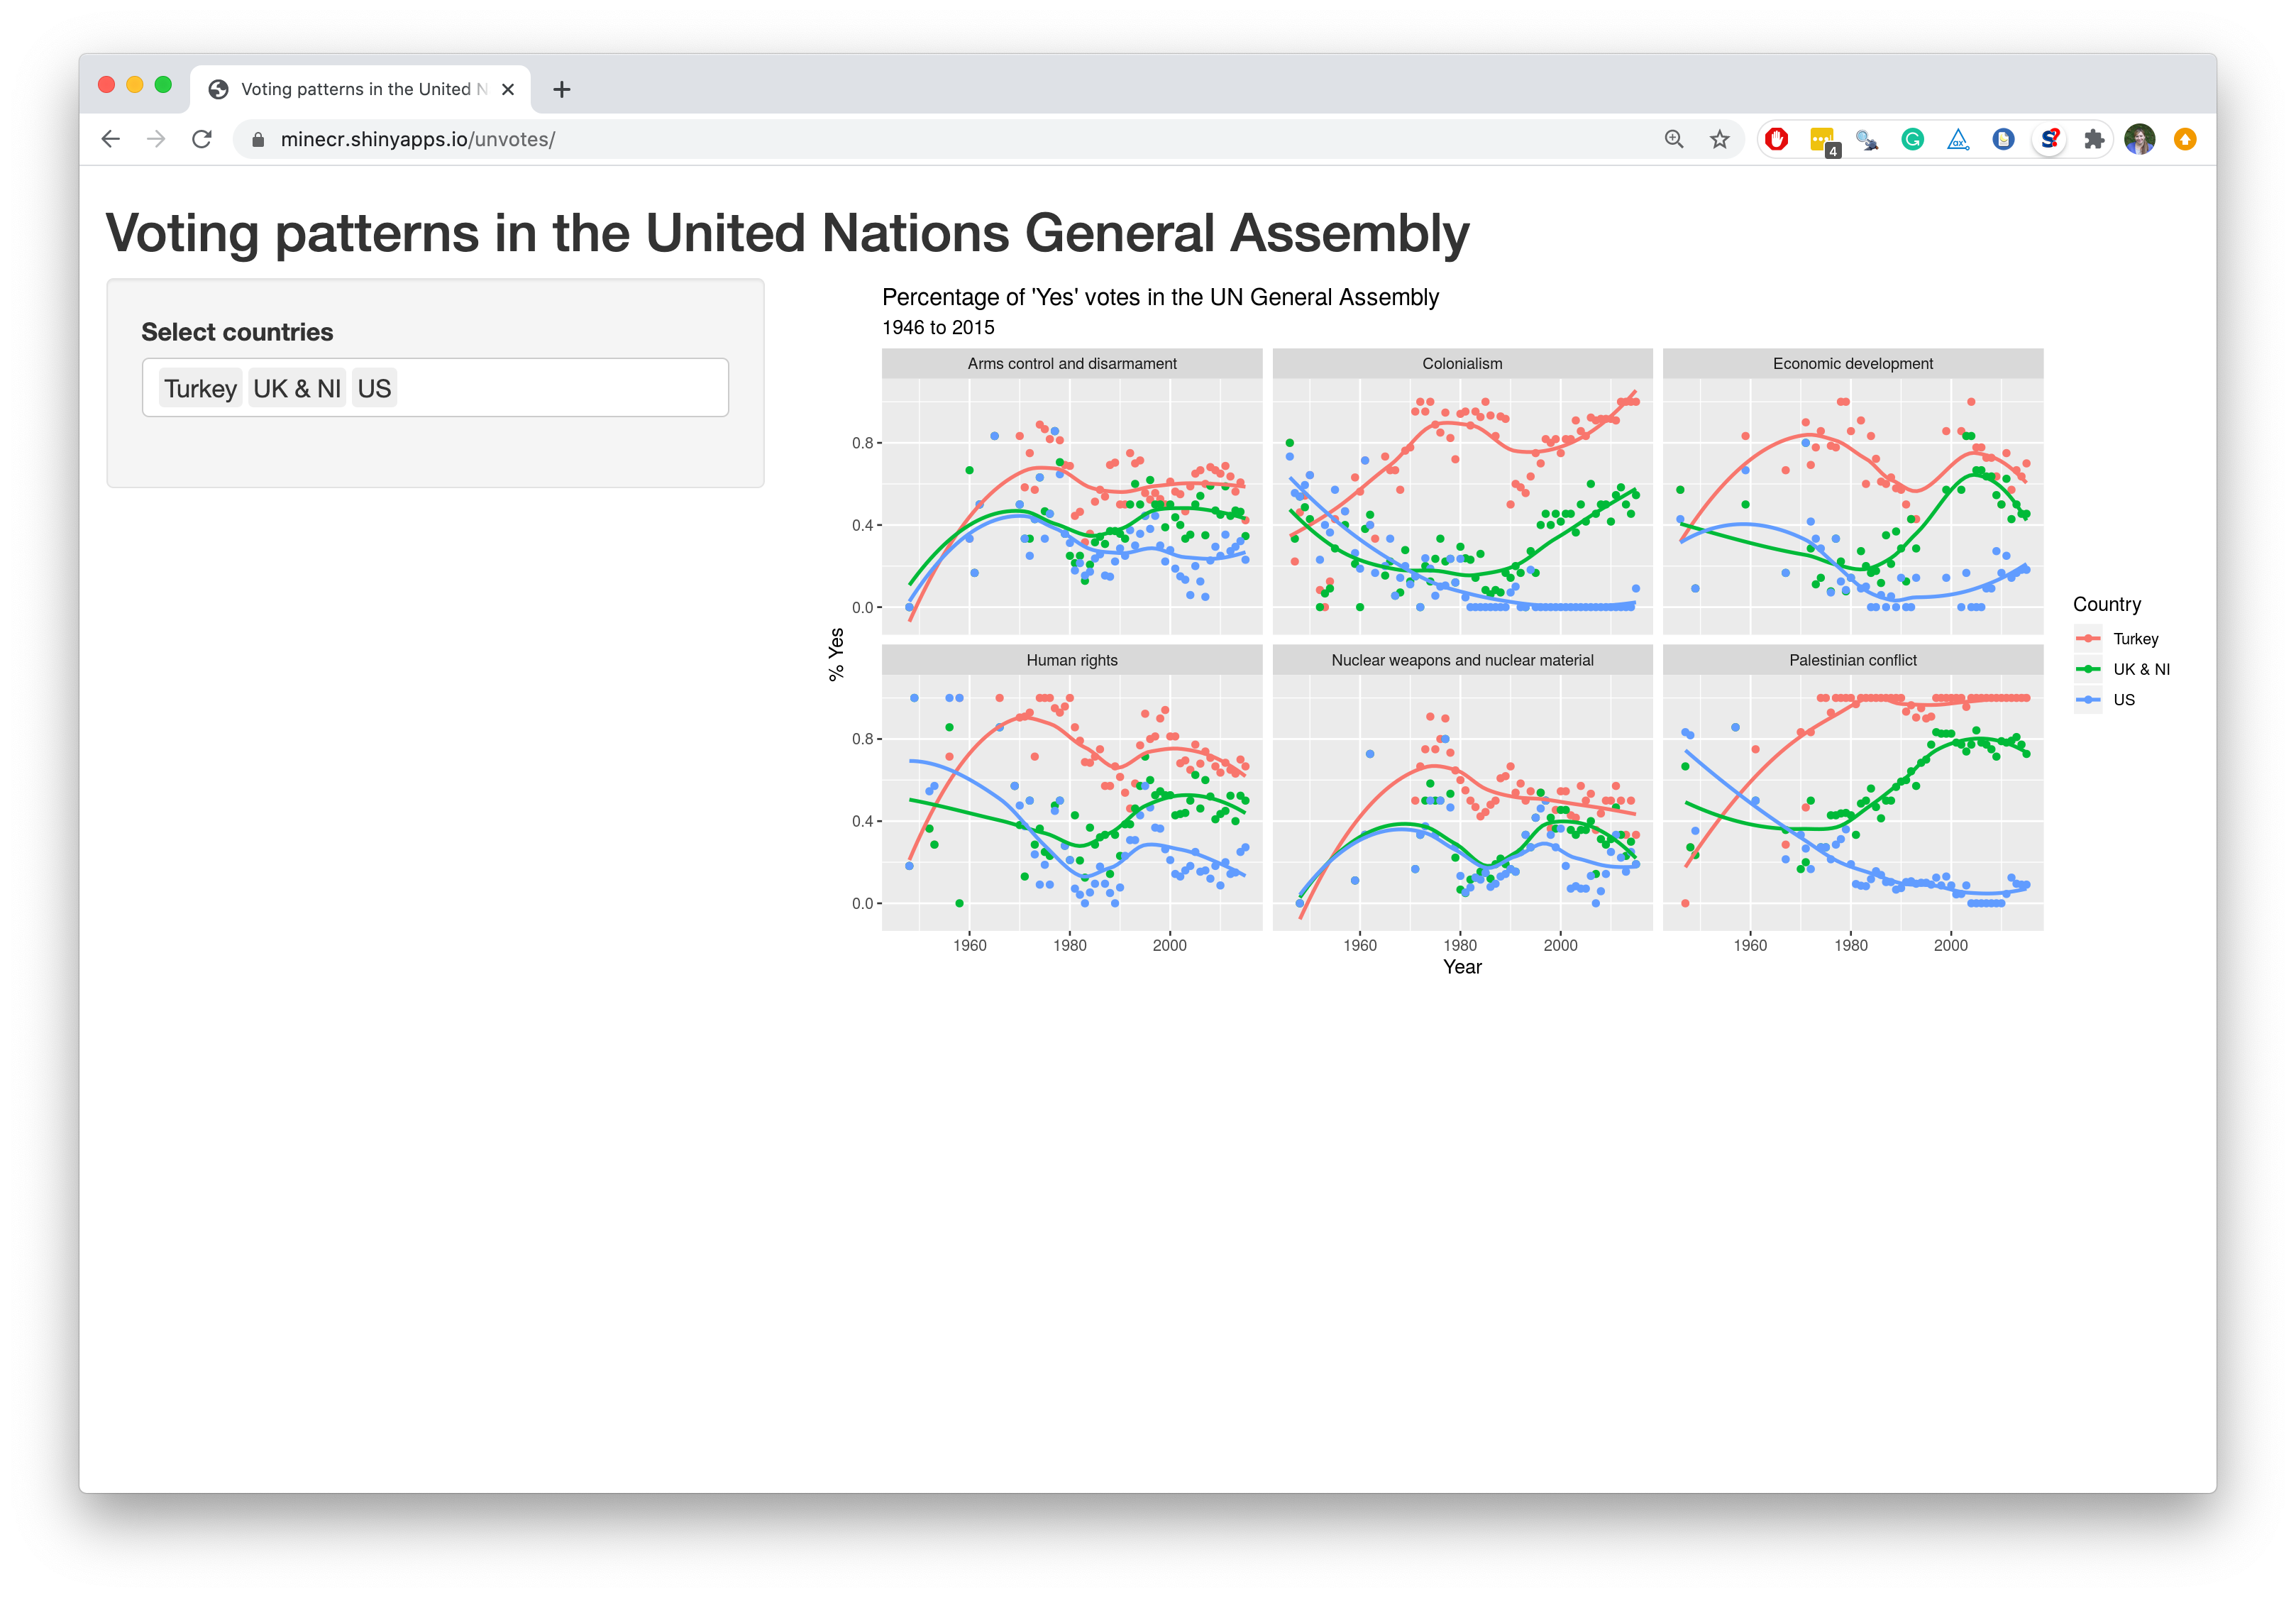
Communicate and visualize the results
What is our role as data analysts?
To tell the stories that data supports, but be sure that we bring out all the stories, all the relevant pieces, make all the connections.
The most important aspect of working with data is the communication we do about it – which requires accuracy and clarity.
As we’ll see, what we eventually want to do is write with data, to construct a story that data helps flesh out.
The data alone are useless, we have to think about it, probe in different ways to see what it can tell us.
# A tibble: 5 × 2
  date             season
  <chr>            <chr>
1 23 January 2017  winter
2 4 March 2017     spring
3 14 June 2017     summer
4 1 September 2017 fall
5 ...              ...